
I’ve looked at the question of how many games a team can expect to win in the season, given their record to date. For example, teams that start the season with a win go on to win 12.3 game in the regular season, on average. But how likely is it that your team will make the finals, from a given point in the season?
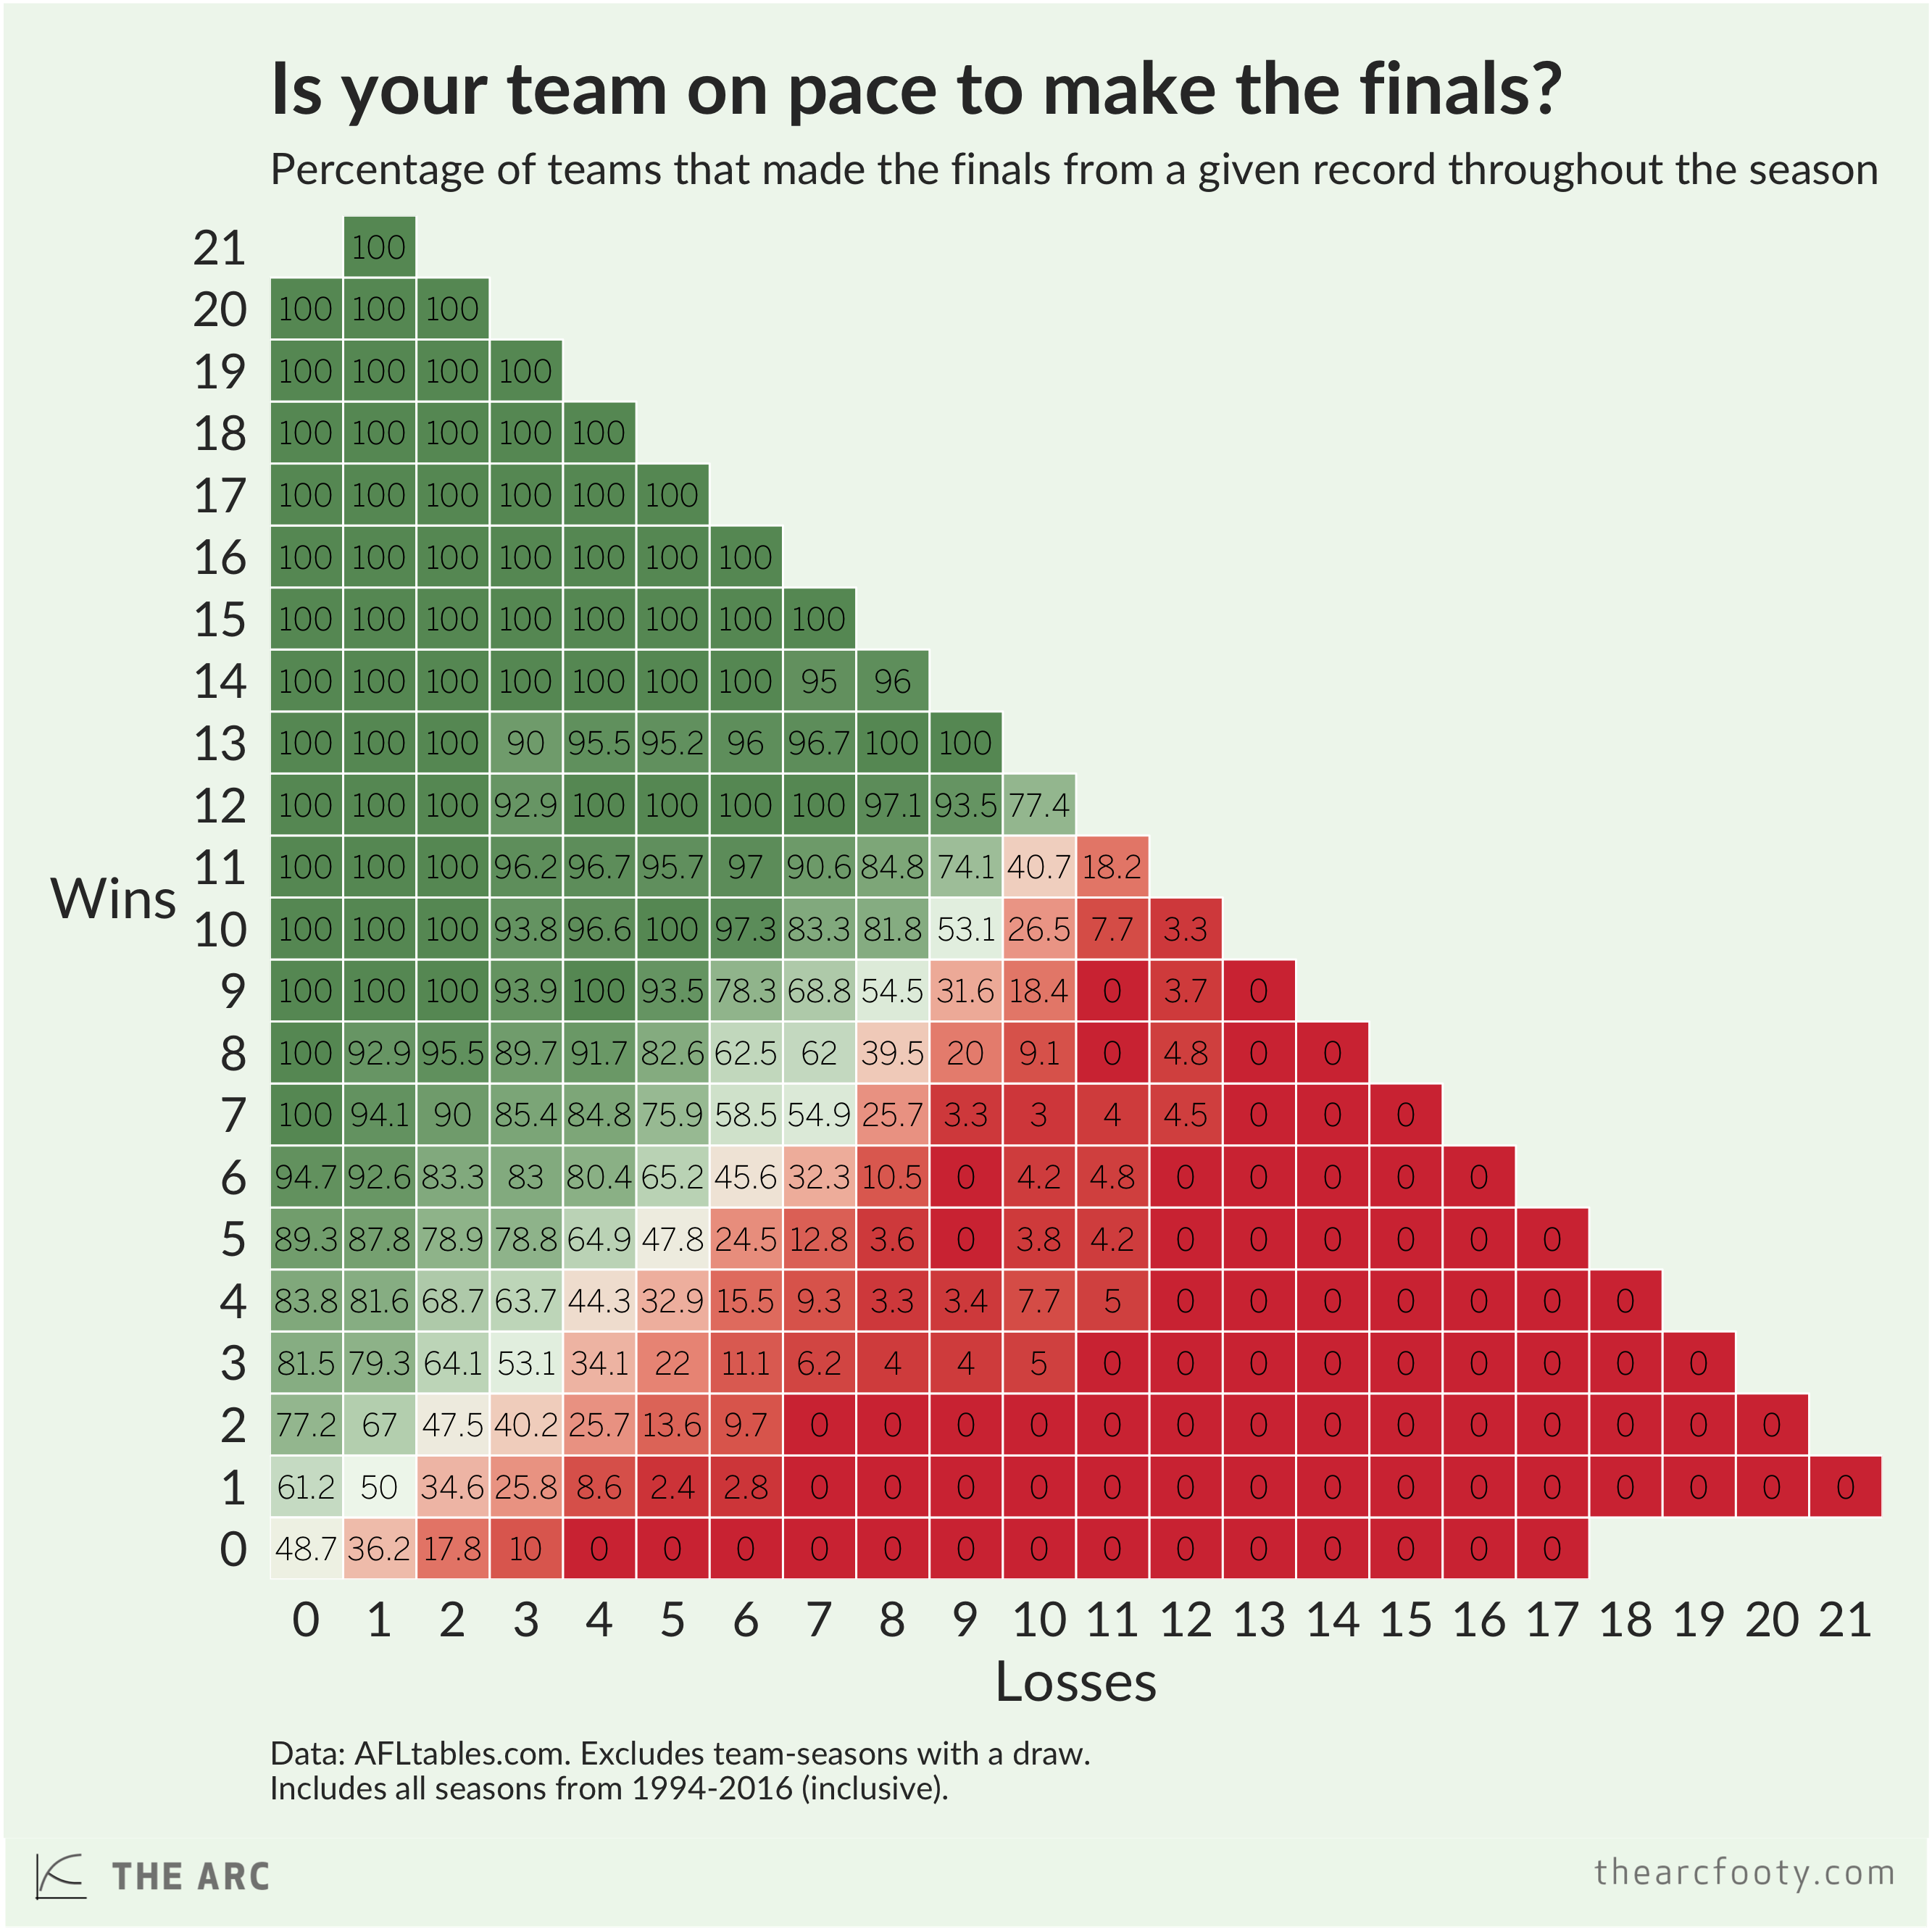
This graph shows the historical record over the period 1994-2016, which is the period in which we’ve had a top eight finals system and each team has played 22 home-and-away games. It shows that, for example, only 10% of teams that have lost their first three games have gone on to make the finals in this period. Teams that win one out of their first three make the finals 34.6% of the time.
Of course, very good teams that start the season 0-3 would have a better than 10% chance of making the finals. To see my latest estimate of each team’s finals chances, based on my Elo model, go here.
The graph above includes the 2013 Bombers, who won 14 games but didn’t play finals due to disqualification. It also includes the 2013 Blues, who took the Bombers’ spot in the finals. Some people have asked for a version without the 13 Bombers and Blues, so here it is:
