
Throughout the 2017 AFL men’s season, I estimated each team’s chance of making the finals, like the massive nerd I am. These estimates were based on simulations using my Elo ratings – in brief, I rate each team based on their past results, then run through the remainder of the season 20 000 times and see how often each club ends up in the finals. I’m far from the only one who does this sort of thing for footy, which raises the question: how well do my Elo-based sims compare to others’ estimates?
Tony Corke at Matter of Stats and Karl Jackon at Champion Data each published estimates of each team’s chance of making the finals through much of the 2017 season, based on their own simulations. Each of the three of us has a broadly similar approach, but with key differences. Tony’s simulations are based on his own team ratings system, which is a bit more sophisticated than my Elo ratings, and his approach to simulations differs a little to mine. The Champion Data simulations are based on the official player ratings – teams’ chance of winning games is based on the quality of the players that are expected to take the field, rather than being based on a player-blind team rating like the systems Tony and I use.
Despite these differences, the results are really very similar. Each of the three systems pretty much agreed on each team’s chance of making the finals at most points in 2017.
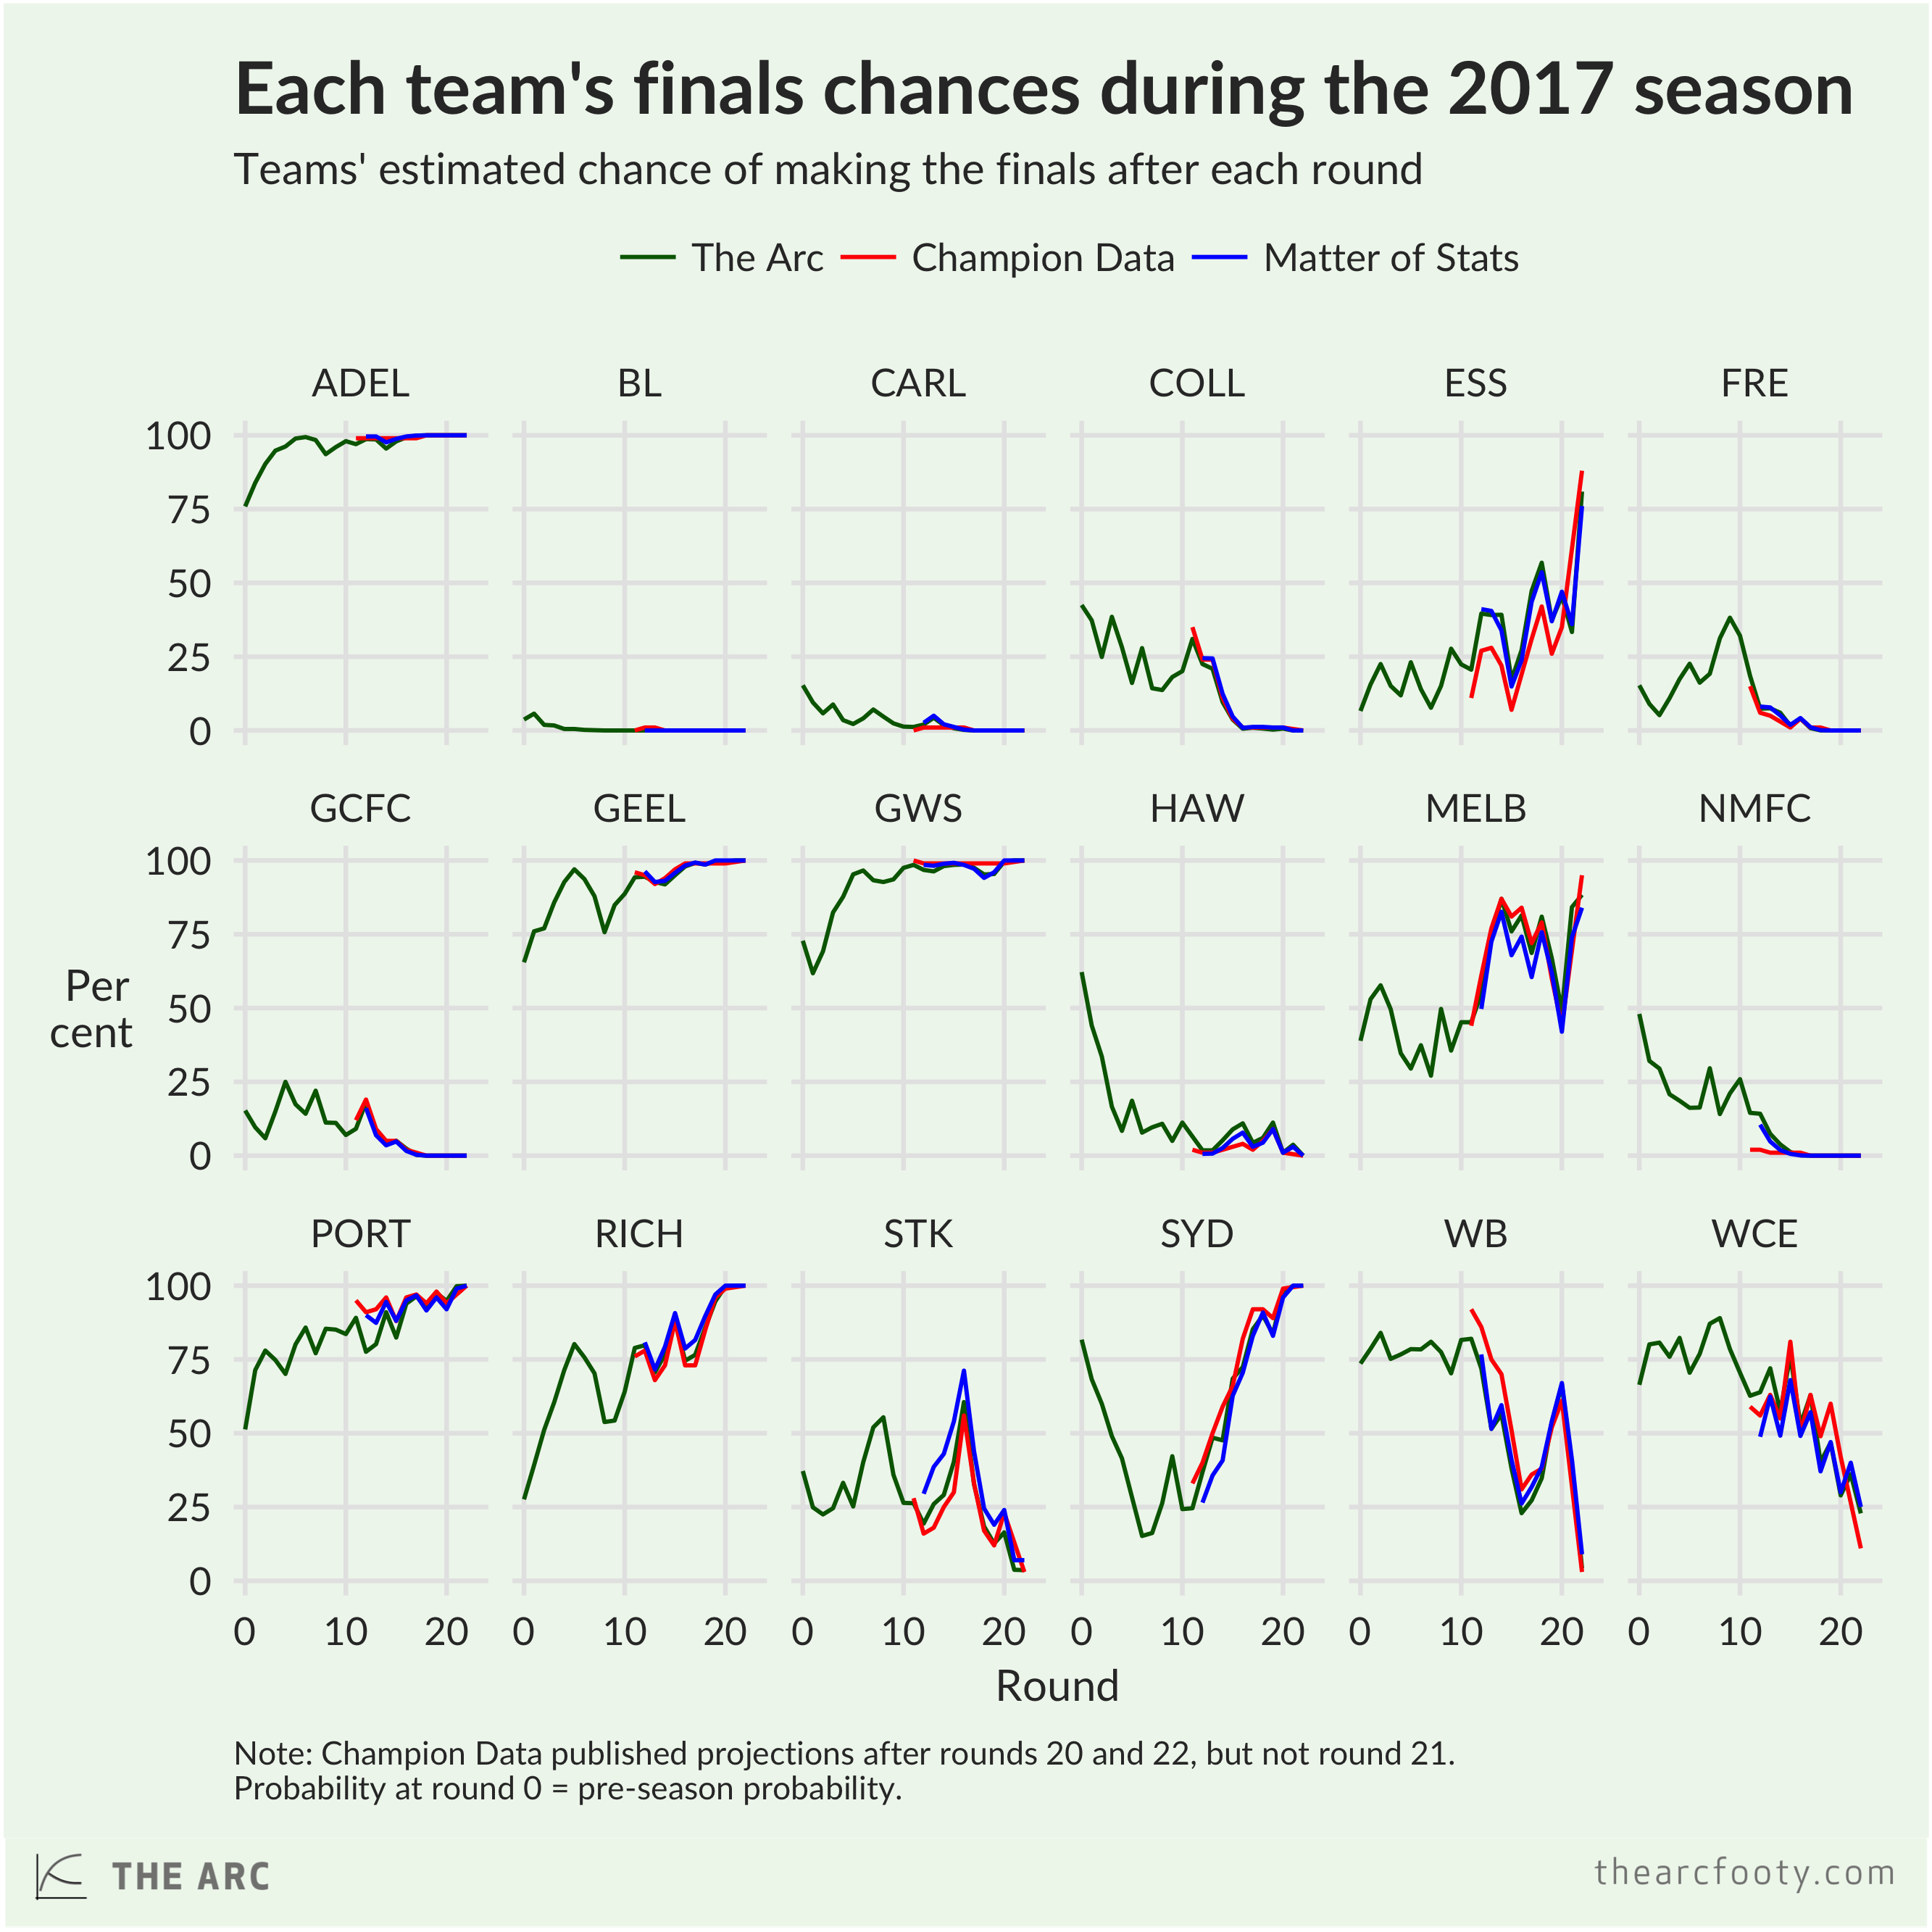
There are a few – relatively small – differences that stand out to me. Champion Data’s system was quicker to figure out that North Melbourne had no hope – probably a benefit of their player rating-based approach. But on the other hand, CD’s estimates were even slower to catch on to the new, improved Bombers than the two team rating-based systems. Tony was a little more bullish on the Saints through the middle of the season than the other two systems, and Champion Data rated the Bulldogs a bit higher than the others. But for the most part, the three different systems pretty much agreed on the state of play through the 2017 season.1
Which estimates were better? Well before we answer that, we have to figure out what we mean by ‘better’. I’ve scored each model using the Brier score. 2 The best Brier score is zero – you score a zero if all your predictions are correct and you were 100% certain in your predictions. You’d score a one – the worst possible score – if all your predictions are wrong and you were 100% certain in your predictions. The main thing you need to know about a Brier score is that a lower score is better.
As you’d expect, each of the three models got better as the season went on – it’s easier to pick the finalists after round 22 than after round 12. I was pleasantly surprised, though, at how well my early-season season predictions hold up – my estimates after round 1 weren’t too much worse than those after rounds 7 and 8 ,and my predictions after round 2 were about as good as those after round 10 or 11. I was also very happy to discover that my simulations held up against Tony’s and CD’s. Champion Data had the best simulations after rounds 19 and 20, but in all other rounds3, mine had a (slightly) lower Brier score. My score was similar to Tony’s – slightly better than Ton’y through the middle part of the season, slightly worse at the end.
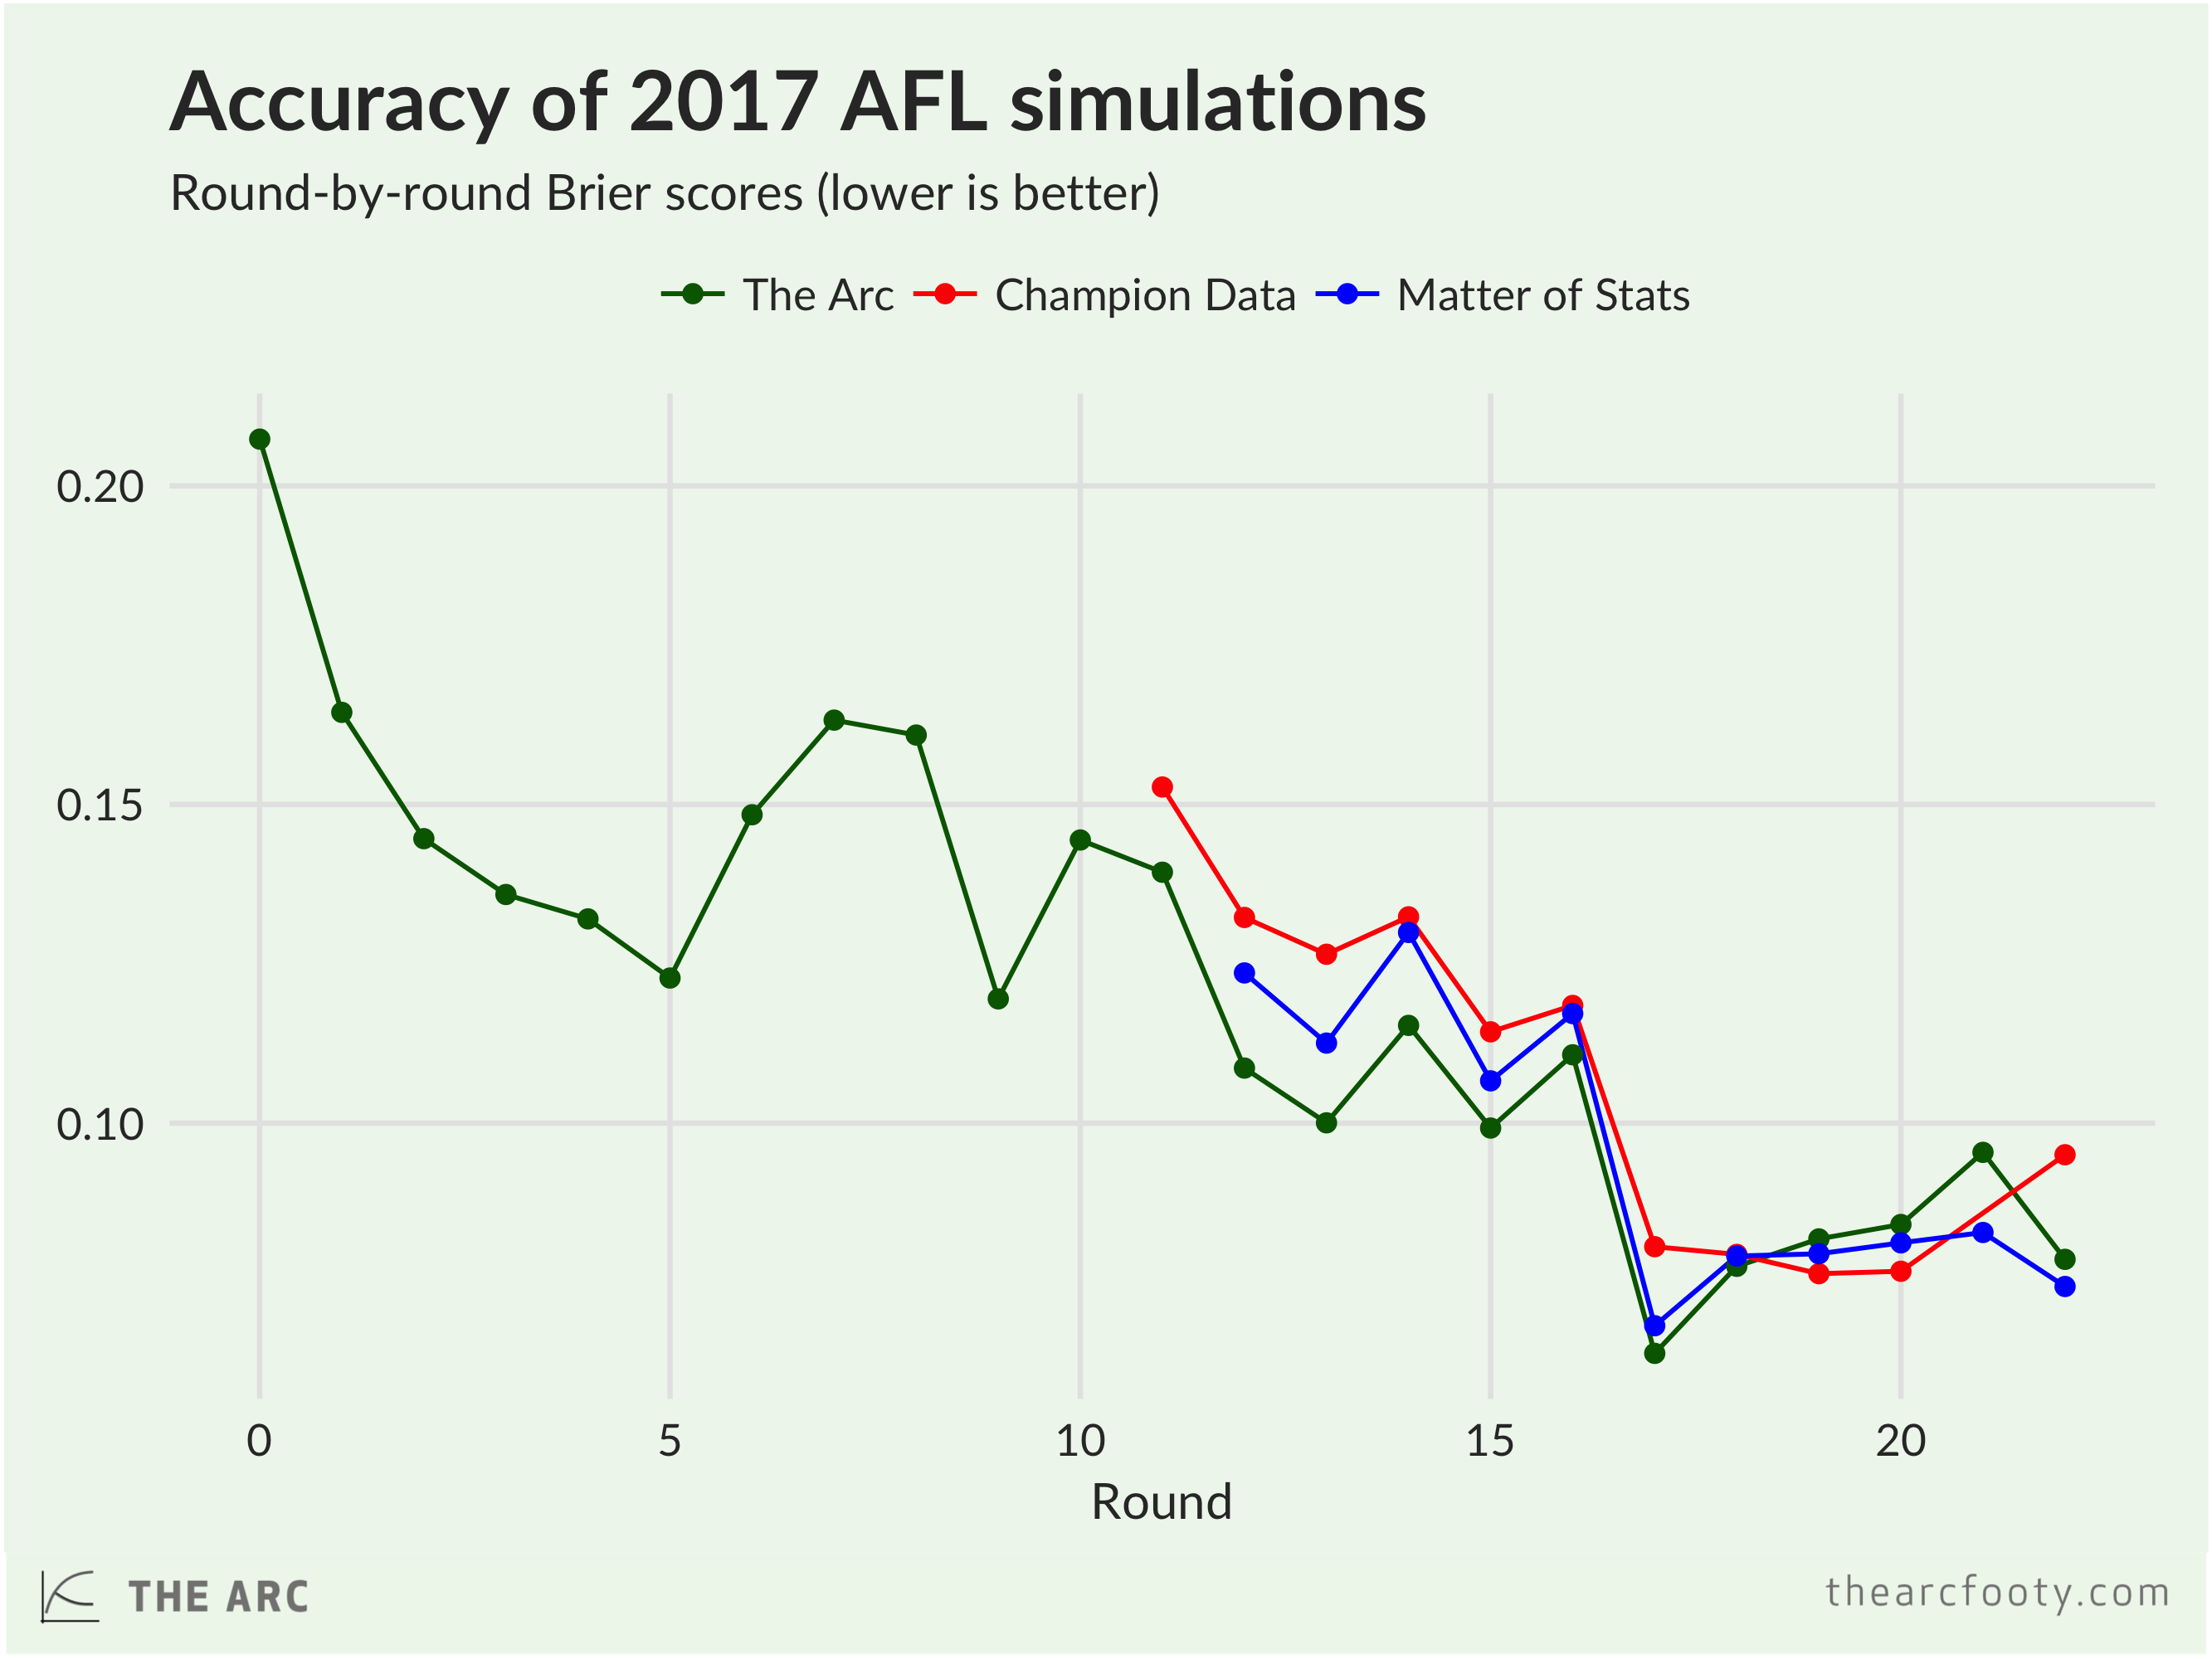
Overall, my Brier score was 0.092, Tony’s was 0.097, and Champion Data’s was 0.1034. Not bad for my first attempt! Footy has a lot of randomness – I reckon if we kept doing this for another 10 years, I’d lose more often than I’d win against Tony and Champion Data. But to be in the same league as them is satisfying.
My conclusions from all this:
- My Elo ratings and simulations could do with a bit of tweaking, but they’re not in need of fundamental surgery. Yay!
- The fact that Elo ratings, and similar systems, don’t take into account player changes (like injuries to star players) is often seen as a major weakness, but the predictions hold up reasonably well compared to a player ratings-based system.
- Building a system that adequately responds to dramatic shocks like Essendon’s 2016 and 2017 list changes would be basically impossible. CD’s player ratings-based system struggled to catch up to Essendon’s improvement, much as Elo did.
- There’s no obvious point in the season at which predictions become reliable. I’m comfortable with my decision to simulate the season each week, from the pre-season onwards.
Cool story!
- The bivariate correlation coefficient between The Arc and CD is 0.992; between The Arc and MoS is 0.995; between CD and MoS is 0.988.
- The wonks among you might be wondering if other scores – like the log probability score – would give us different results. Nope! The picture is much the same with the log prob score.
- All other rounds for which CD published their simulation results, I mean
- These figures pertain to all rounds in which all three modellers published estimates