
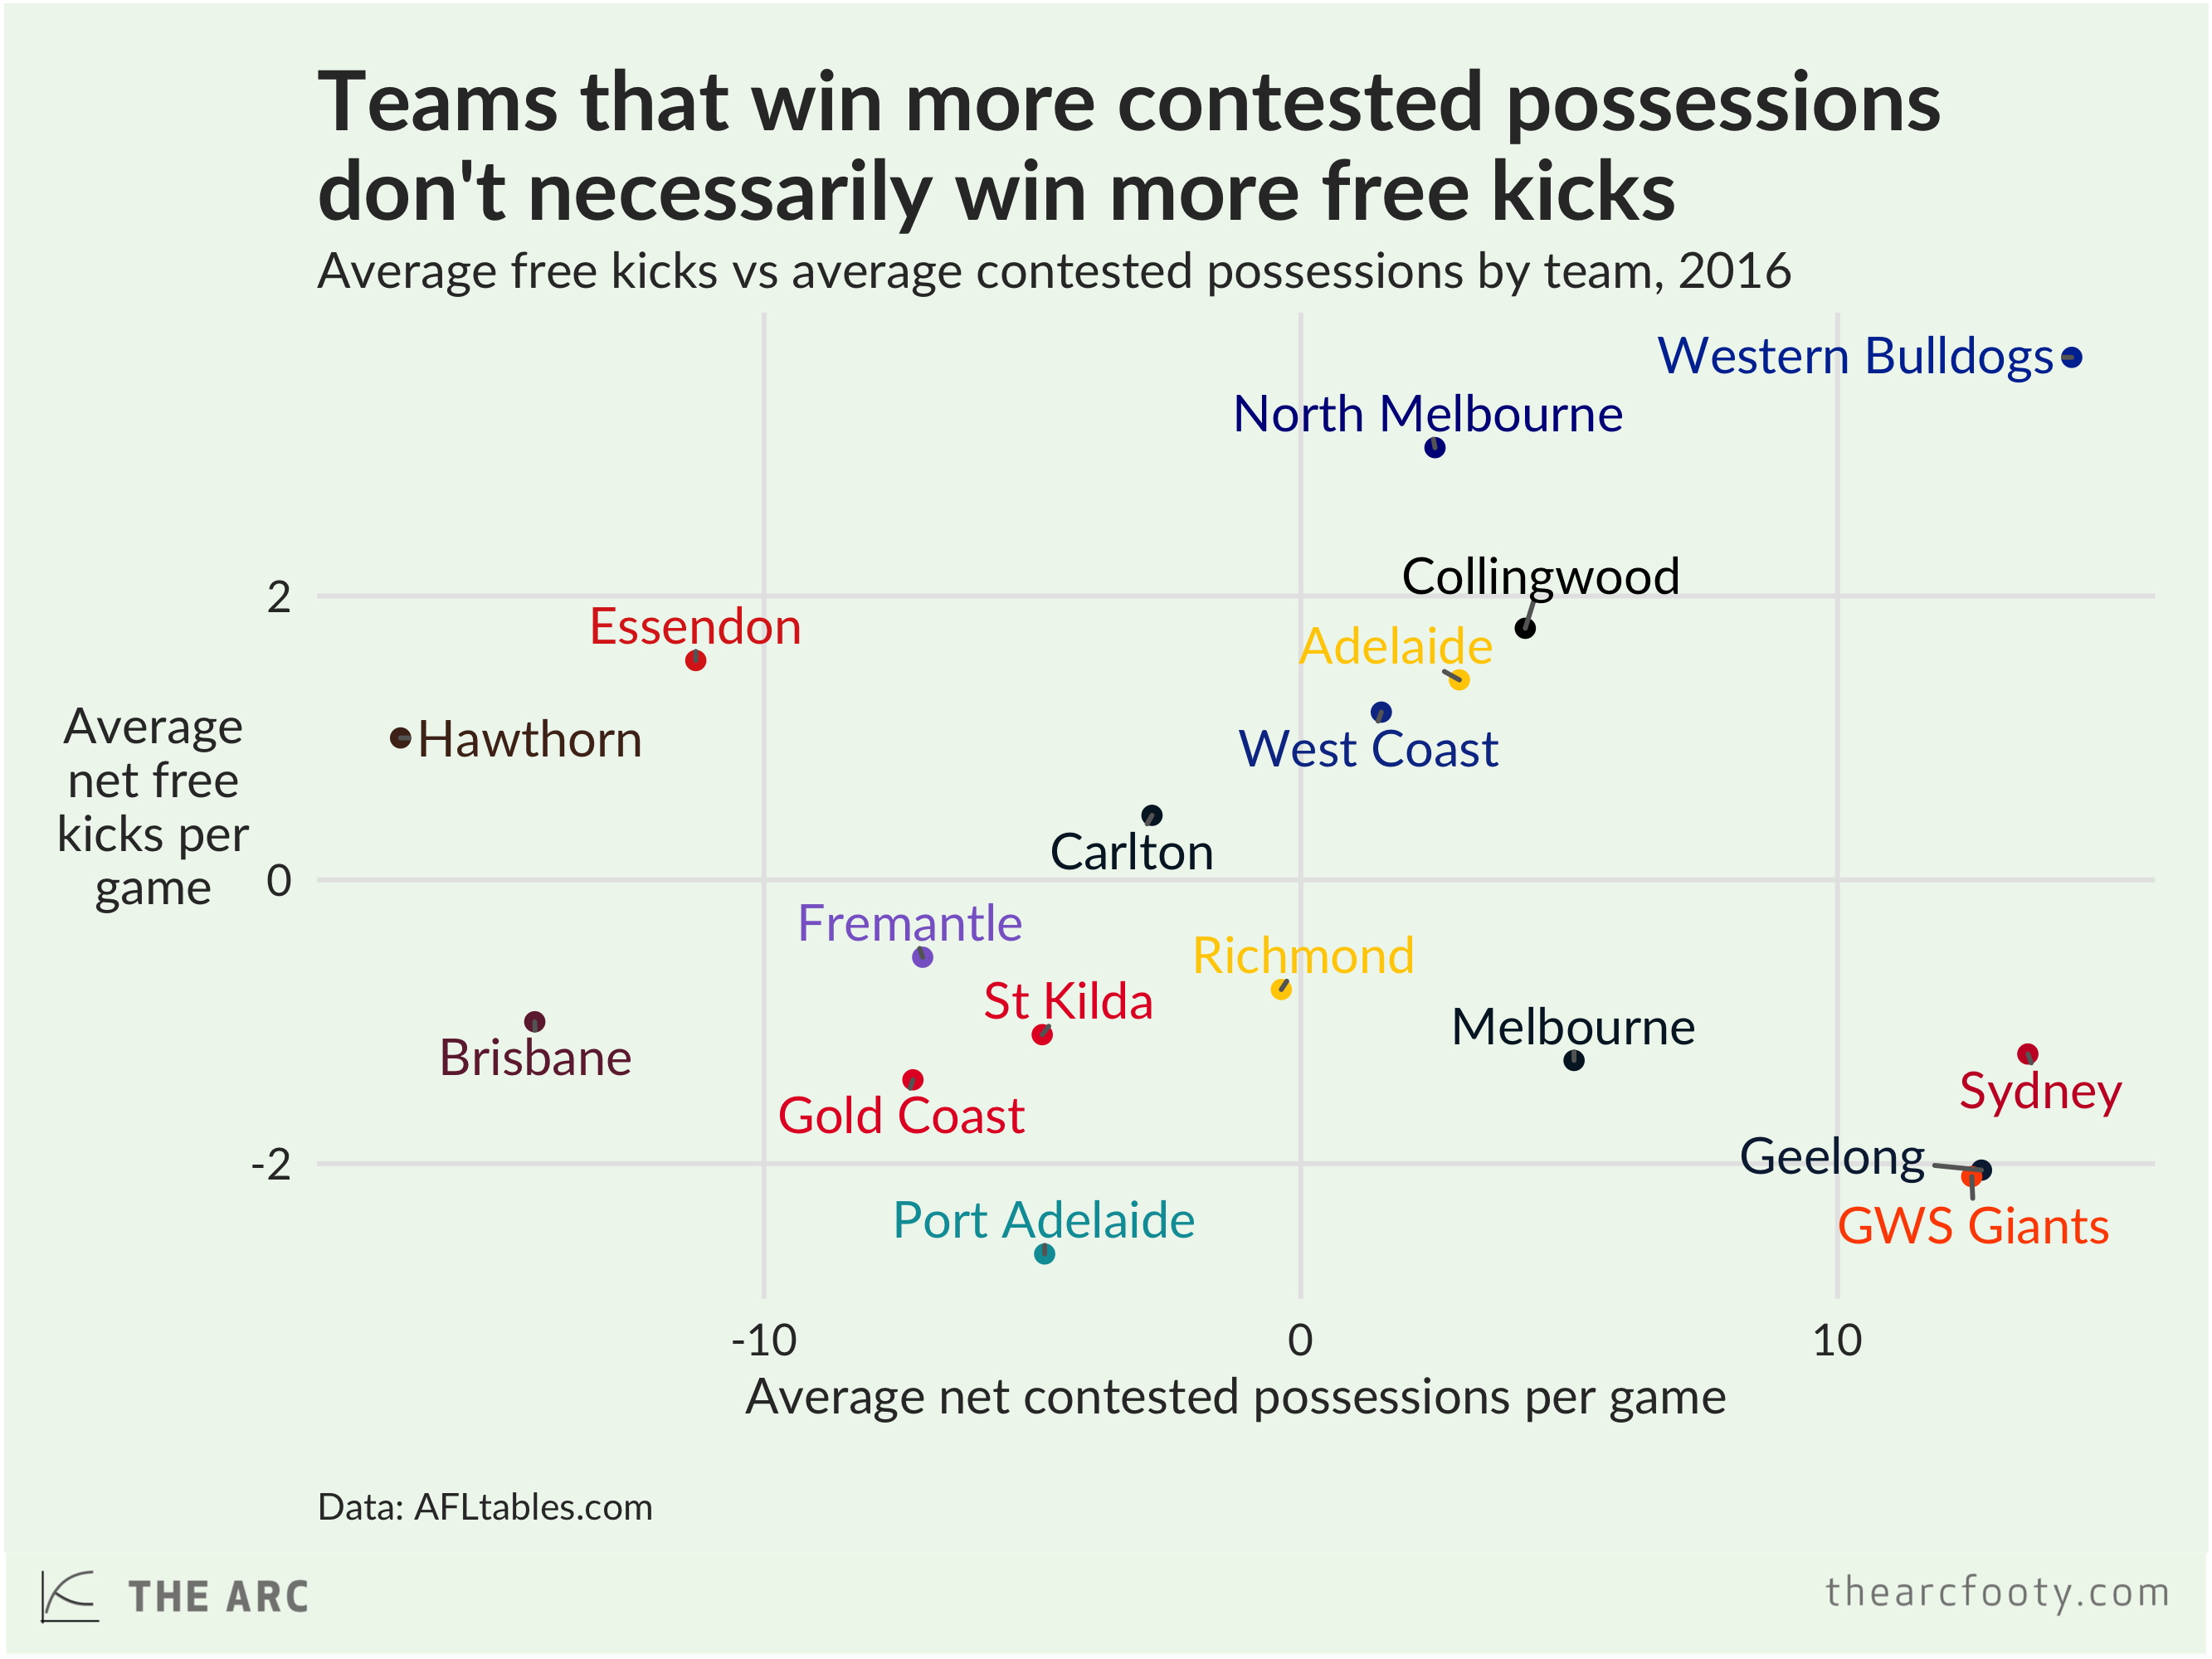
The Bulldogs ended the home and away season with a clear lead in the free kick count, having won 81 more frees than they’d given away. The next highest net free kick total belonged to the Kangaroos (67), followed by Collingwood (39).
When stats like this are pointed out, a common response is to ask whether teams win more free kicks because they win more of the contested ball. The answer, for this year at least, is not really. The Swans, Giants, and Cats all ended the home-and-away season with a similar average contested possession differential as the Bulldogs, yet the Dogs had far more net free kicks.
To look into this relationship a little further, we can compare free kick and contested possession figures for every game since 1999. It turns out to be true that teams that win the contested possession count in a particular game also tend to win the free kick count, but the relationship is pretty weak and noisy.
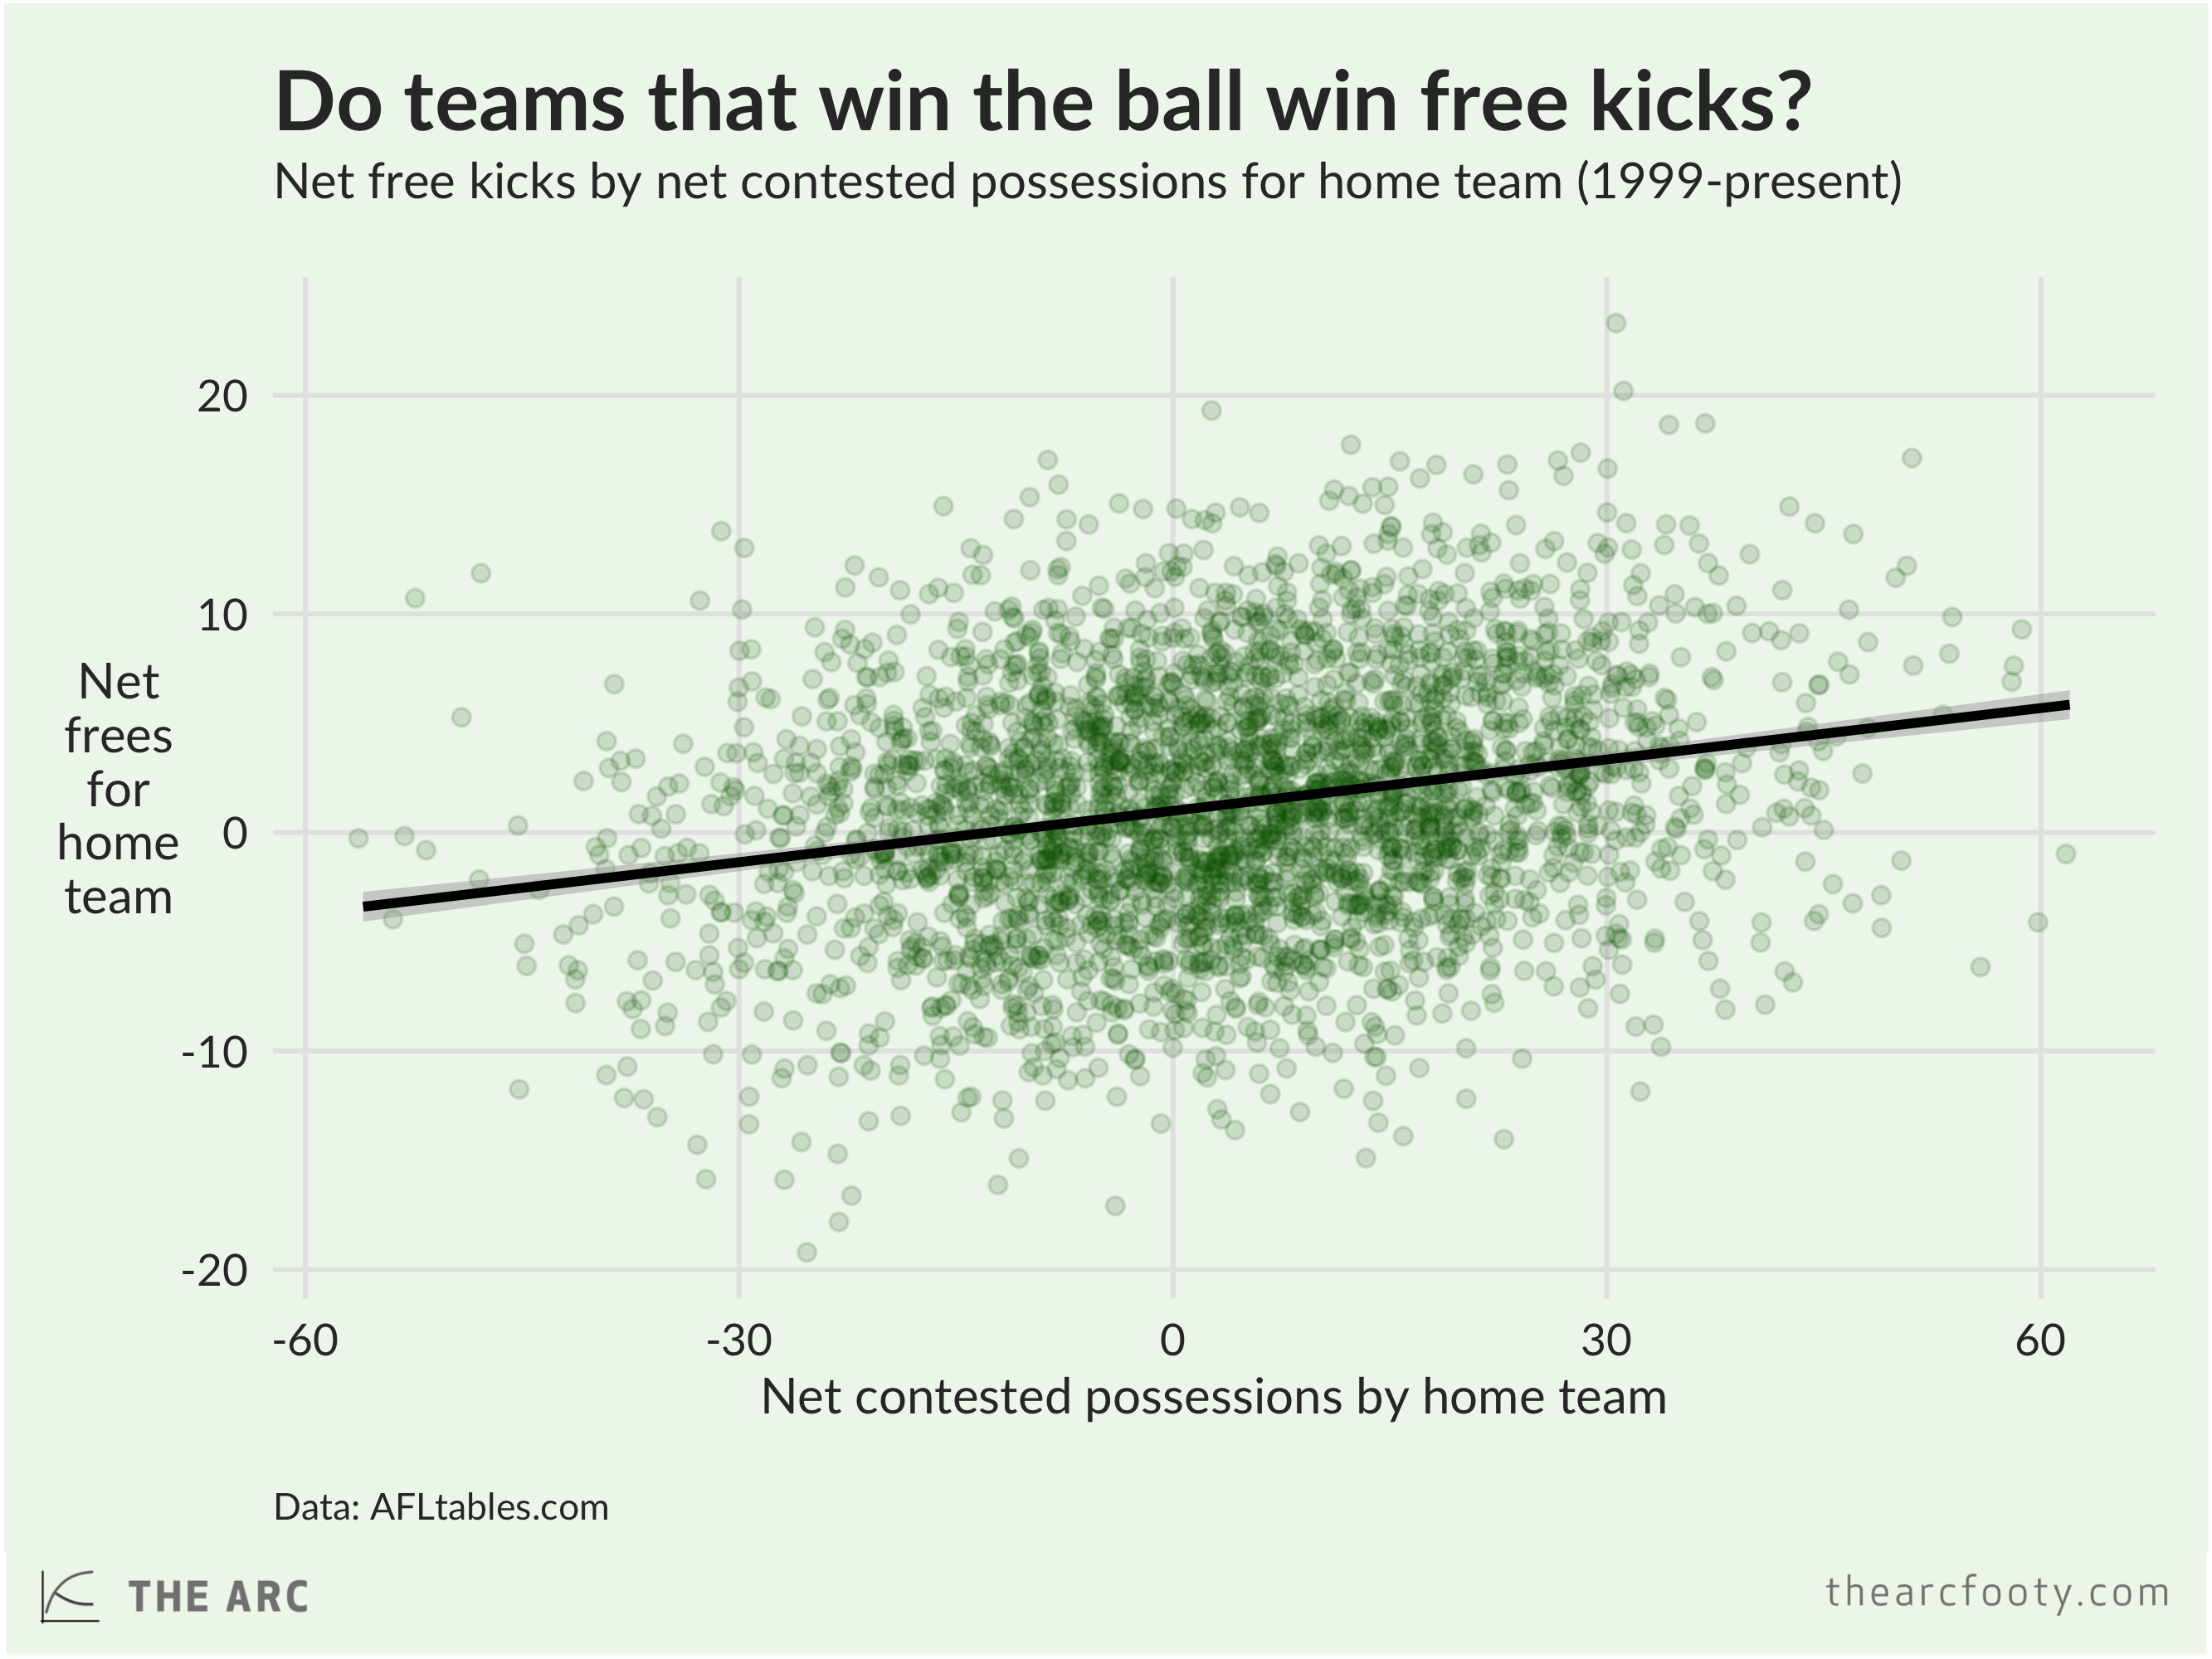
On average, one net contested possession is associated with 0.08 extra net free kicks. This means that if a team gets about 13 more contested possessions than their opponents, we should expect them to win 1 free kick more than their opponents. That’s not nothing, but it’s a fairly weak correlation, and you can tell from the graph above that contested possessions are far from the only thing influencing free kick counts. The contested possession differential in a game only explains, in a statistical sense, 5.8% of the free kick differential.[1]
We can explain free kick counts better if we take a few more things into account. Let’s add tackles and uncontested possessions into the mix. We’ll also add a variable that takes the value of 1 if a game is being played in the “away” team’s home state. With these things added in, we can now statistically explain about 7.6% of the variation in net free kick counts from game to game.
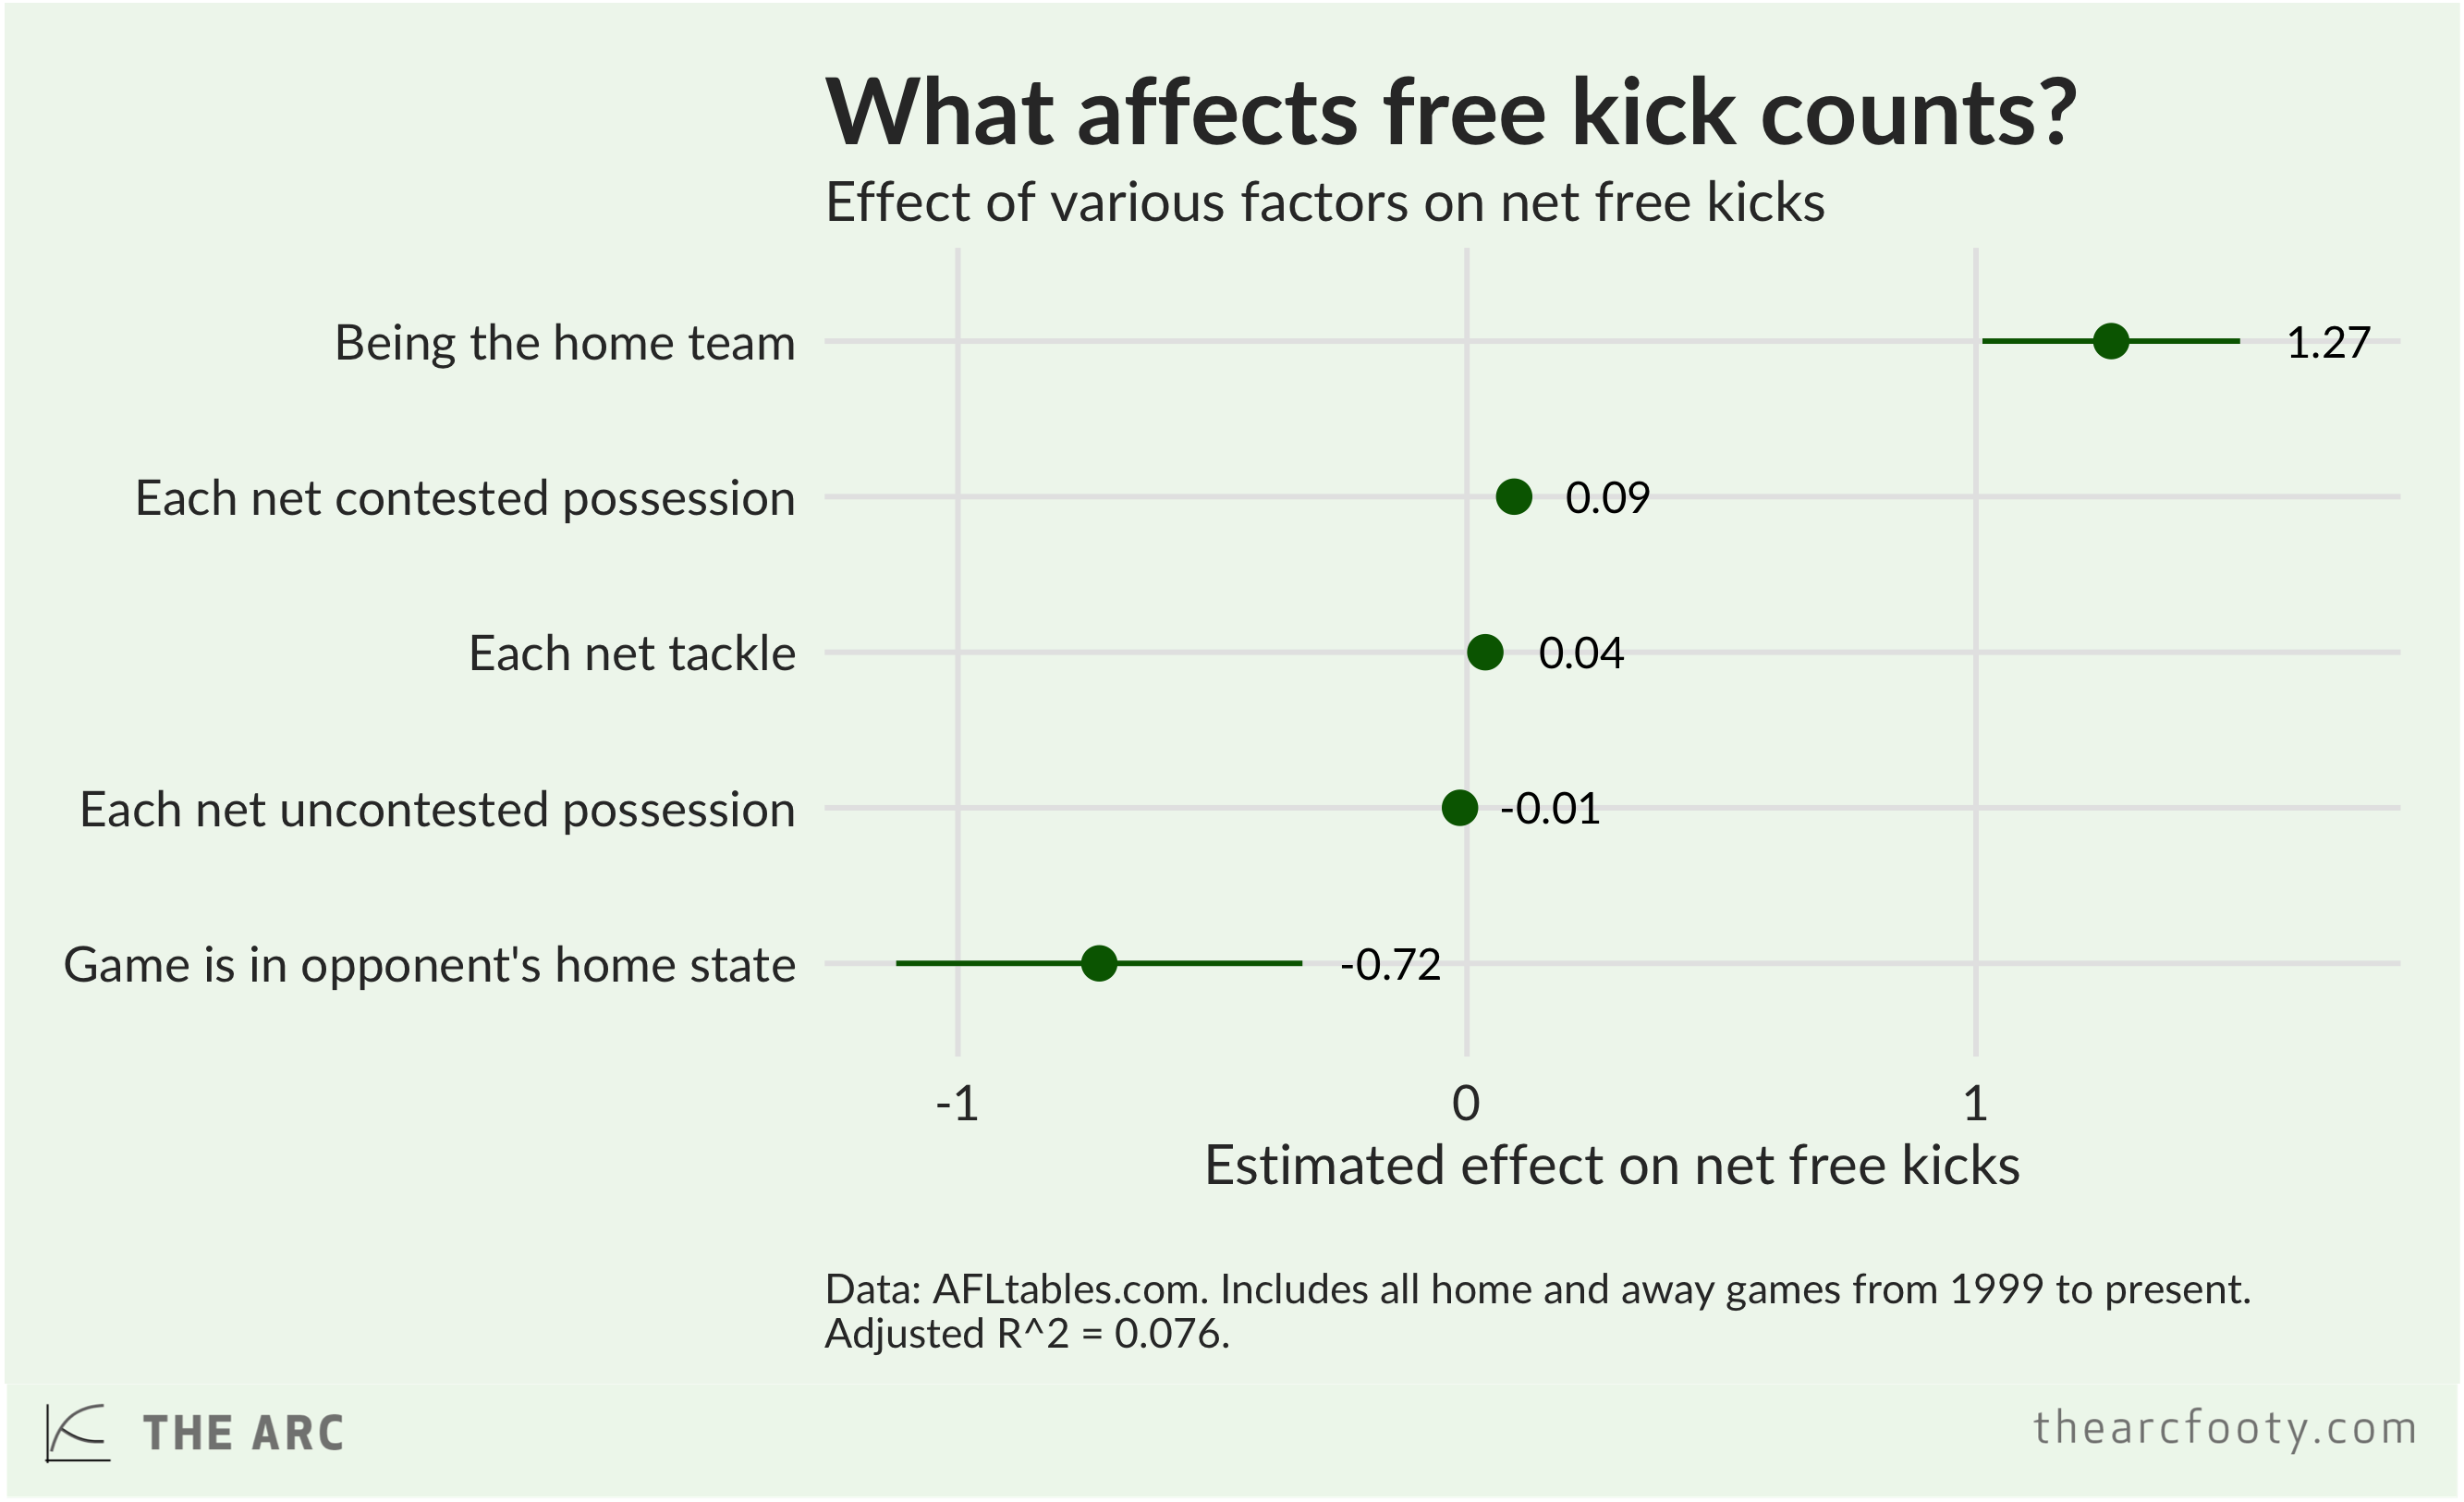
If two teams ended a game with the same number of possessions and tackles, then on average we’d expect the home team to finish with 1.27 more free kicks than their opponents. If the game was being played in the away team’s home state, this would fall to 0.55. Each net contested possession for the home team adds, on average 0.09 net free kicks to their total, while each net tackle adds 0.04.
But we can improve on that further and develop a better model for free kick counts. On average, home teams receive 1.27 more free kicks than their opponents, after we control for the possession and tackle counts and the opponent’s home state. That 1.27 average net free kicks for the home team conceals a lot of variation. Not all home teams are equal. We can break that average effect up, to look at the average free kicks received by each club, when they’re playing at home and we’ve controlled for other things. When we do that, we can explain about 14% of the variation in net free kicks.
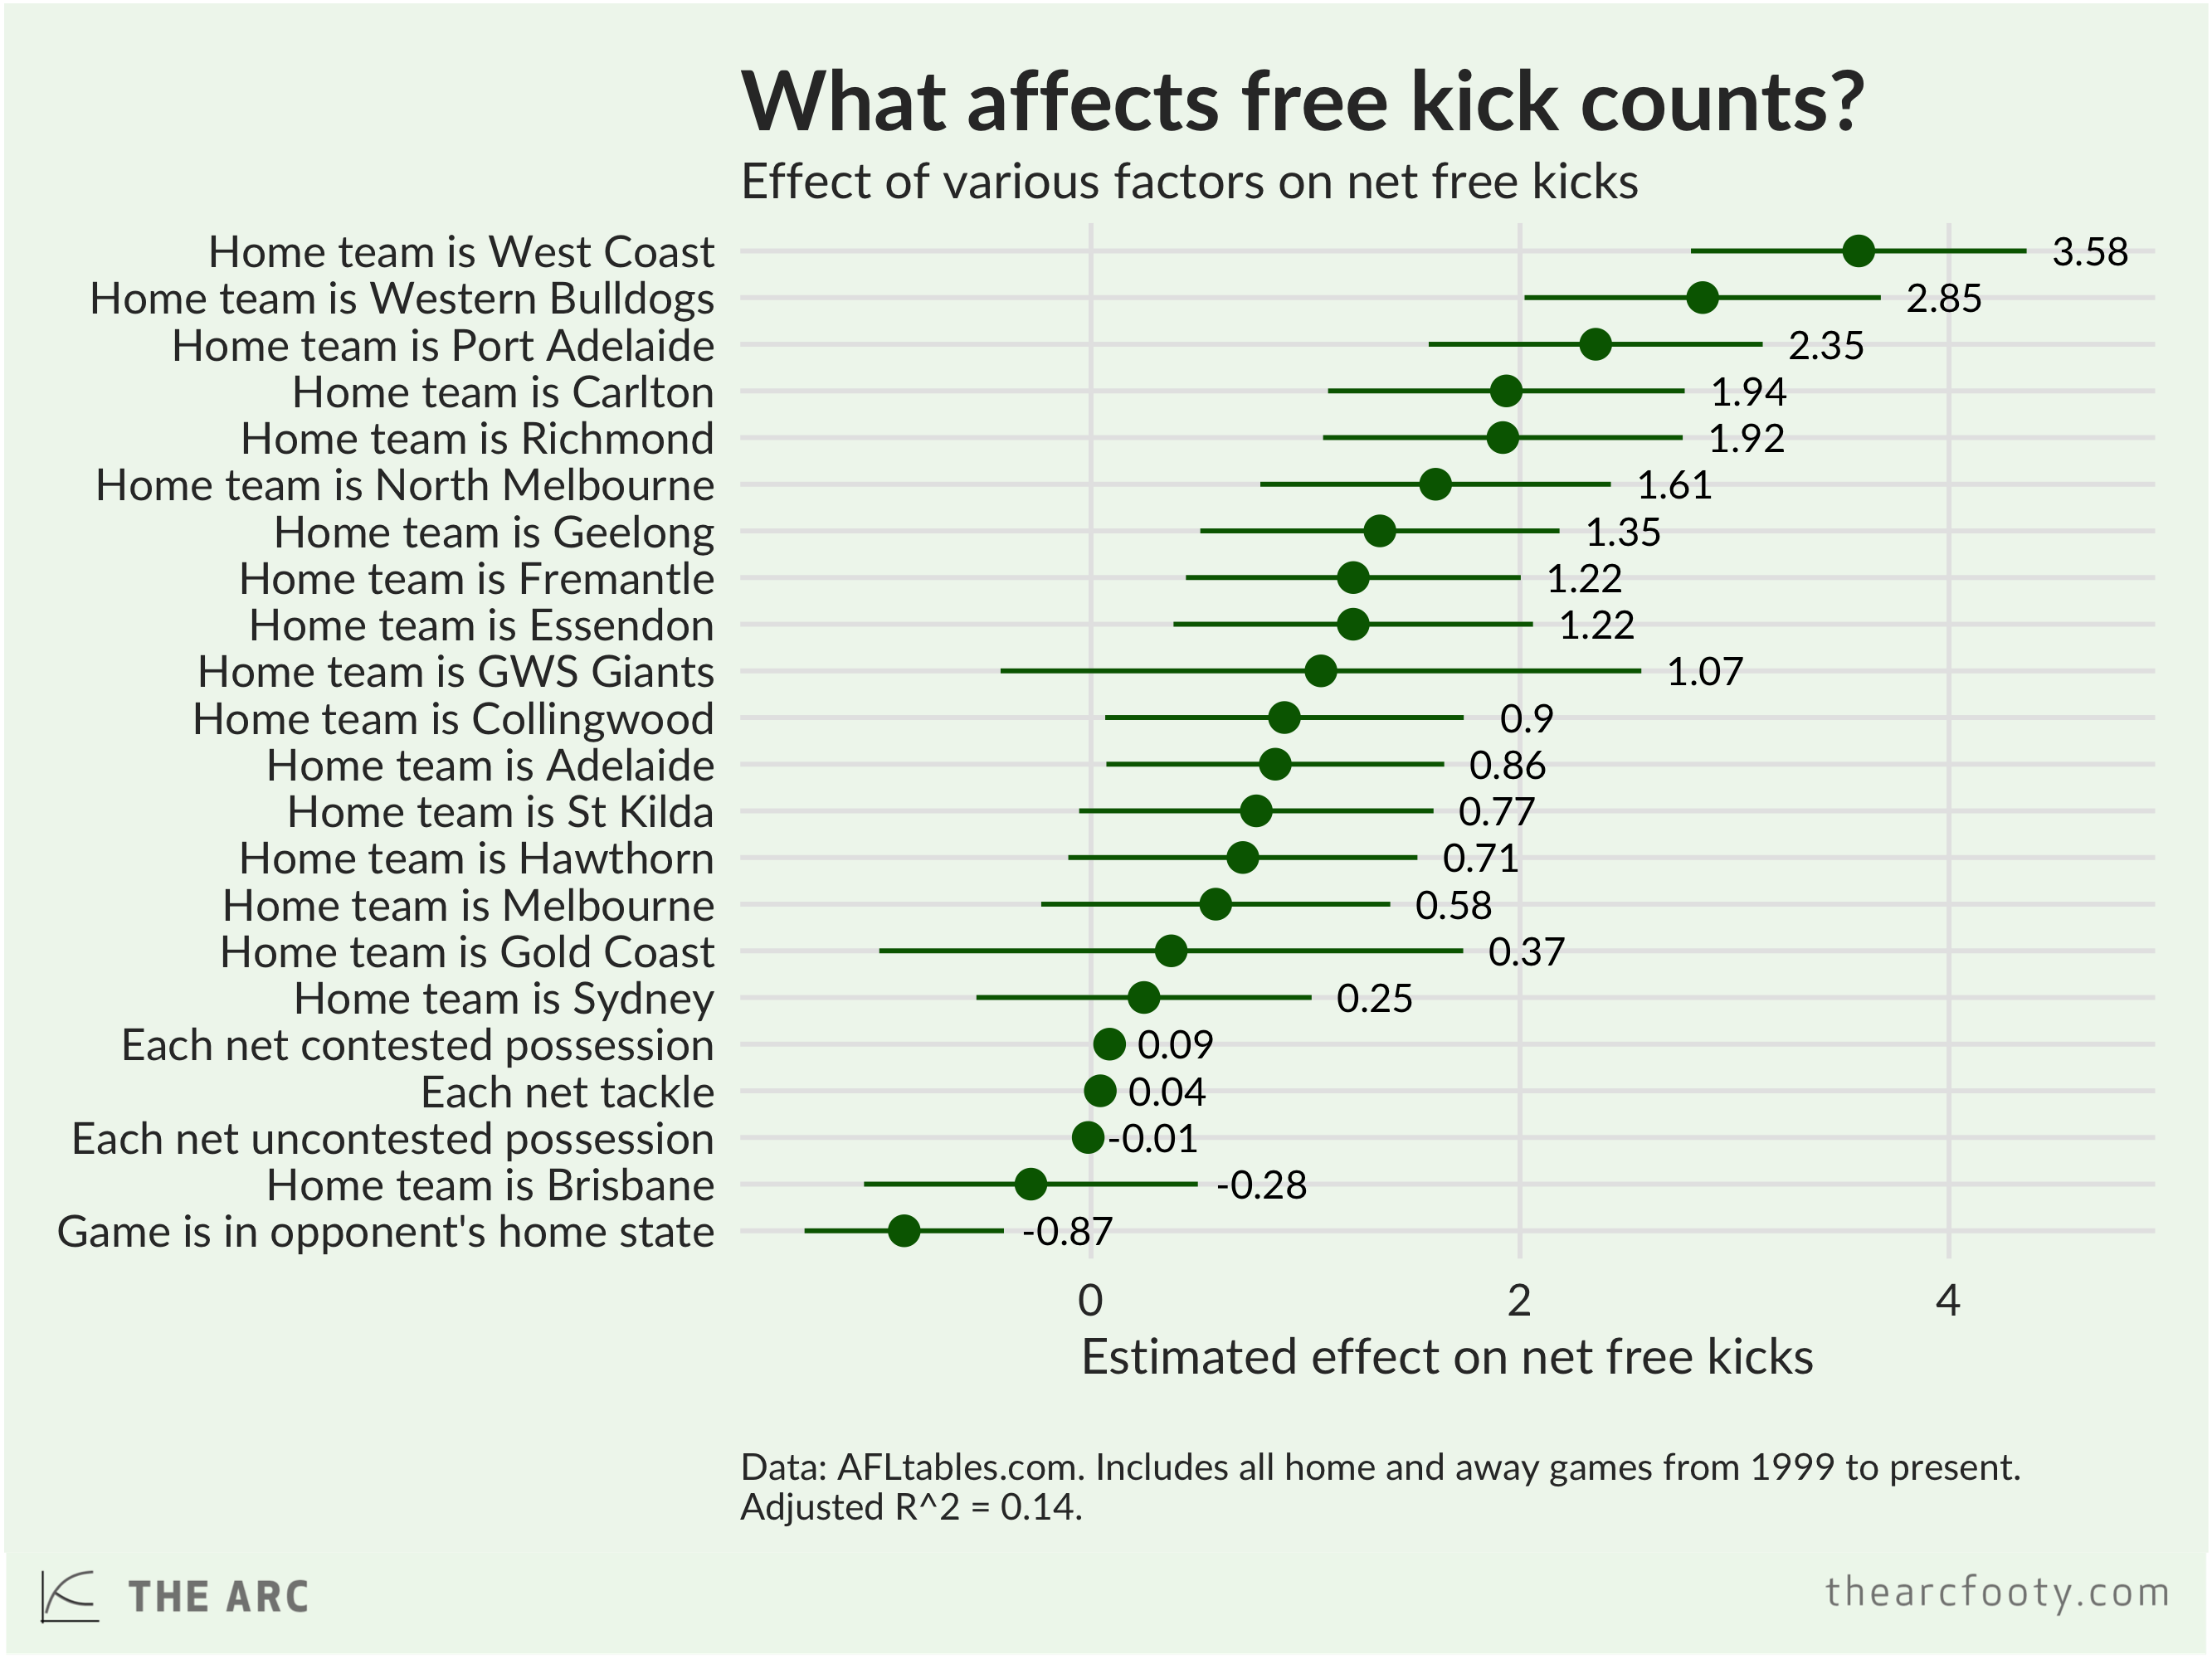
It turns out that the biggest effect on net free kicks, on average, comes from being the West Coast Eagles. If the Eagles are playing at home against a team other than Freo, and the sides draw on possessions and tackles, then on average you’d expect West Coast to end the night with 3.58 more free kicks than their opponents. We’d only expect the Eagles to draw even with their opponents on the free kick count if the away team won around 40 more contested possessions than West Coast.
If your team wins the contested possession count, you should expect them to win the free kick count on average as well. But this relationship is pretty weak and is swamped by other things.
1. By this I mean that the bivariate relationship depicted in the first chart (regressing net free kicks on net contested possessions) has an R-squared of 0.058.