It’s hard to come up with a single number to encapsulate a player’s contribution to his or her footy team in a particular game. It’s particularly hard to do this if you only know how many kicks, tackles, and other simple stats the player racked up, without information about how effective those disposals were, or where they were located on the ground. Fantasy (aka Dream Team) points are a very simple way to try and sum up a player’s performance – a player accrues 3 points for a kick, 1 for a hit out, and so on. They’re a crude measure.
Champion Data’s Official Player Ratings are a much more sophisticated measure of players’ contribution to games. They’re based on how likely the player’s team was to score before he or she took possession of the ball, and how likely they were to score after the possession. They do this by taking into account the location of the possession, the pressure the player was under, and a range of other important factors. They go well beyond just adding up how many kicks, hit outs, marks and so on a player accrues, as with Fantasy points. The Official Player Ratings (OPRs) are then averaged over a player’s last 40 matches, with the games furthest in the past having a lower weight; only matches within the most recent two seasons are used for OPRs.
The OPRs are a very good predictor of how well teams will perform. If you measure teams’ quality by their average player ratings, you’d do a pretty good job of tipping the outcome of the game by using the difference in teams’ quality. Have a look at this:
@DiveMatthew 0.39 pic.twitter.com/HPkG7gRHTs
— Champion Data AFL (@championdata) October 1, 2016
Phwoar! What you’re looking at there is the difference in teams’ quality, as shown on the horizontal axis, compared to the margin of the game, on the vertical axis. There’s a clear correlation between the two; 39% of the variation in game margins can be explained by the difference in teams’ quality, as measured by OPRs. That’s quite impressive.
This made me wonder: how do crude old Fantasy points compare to OPRs as a predictor of game outcomes? To answer that question, first we need to get from players’ Fantasy points in individual games to a Fantasy-based rating of their overall quality. To do that, I’ve taken a similar approach to the OPRs – a player’s Fantasy Rating is a simple average of his1 Fantasy points per game over his latest 30 games. Unlike the ORPs, there’s no diminishing weight applied to games further in the past, and the moving average isn’t confined to the most recent two seasons. My method is simple and dumb.2
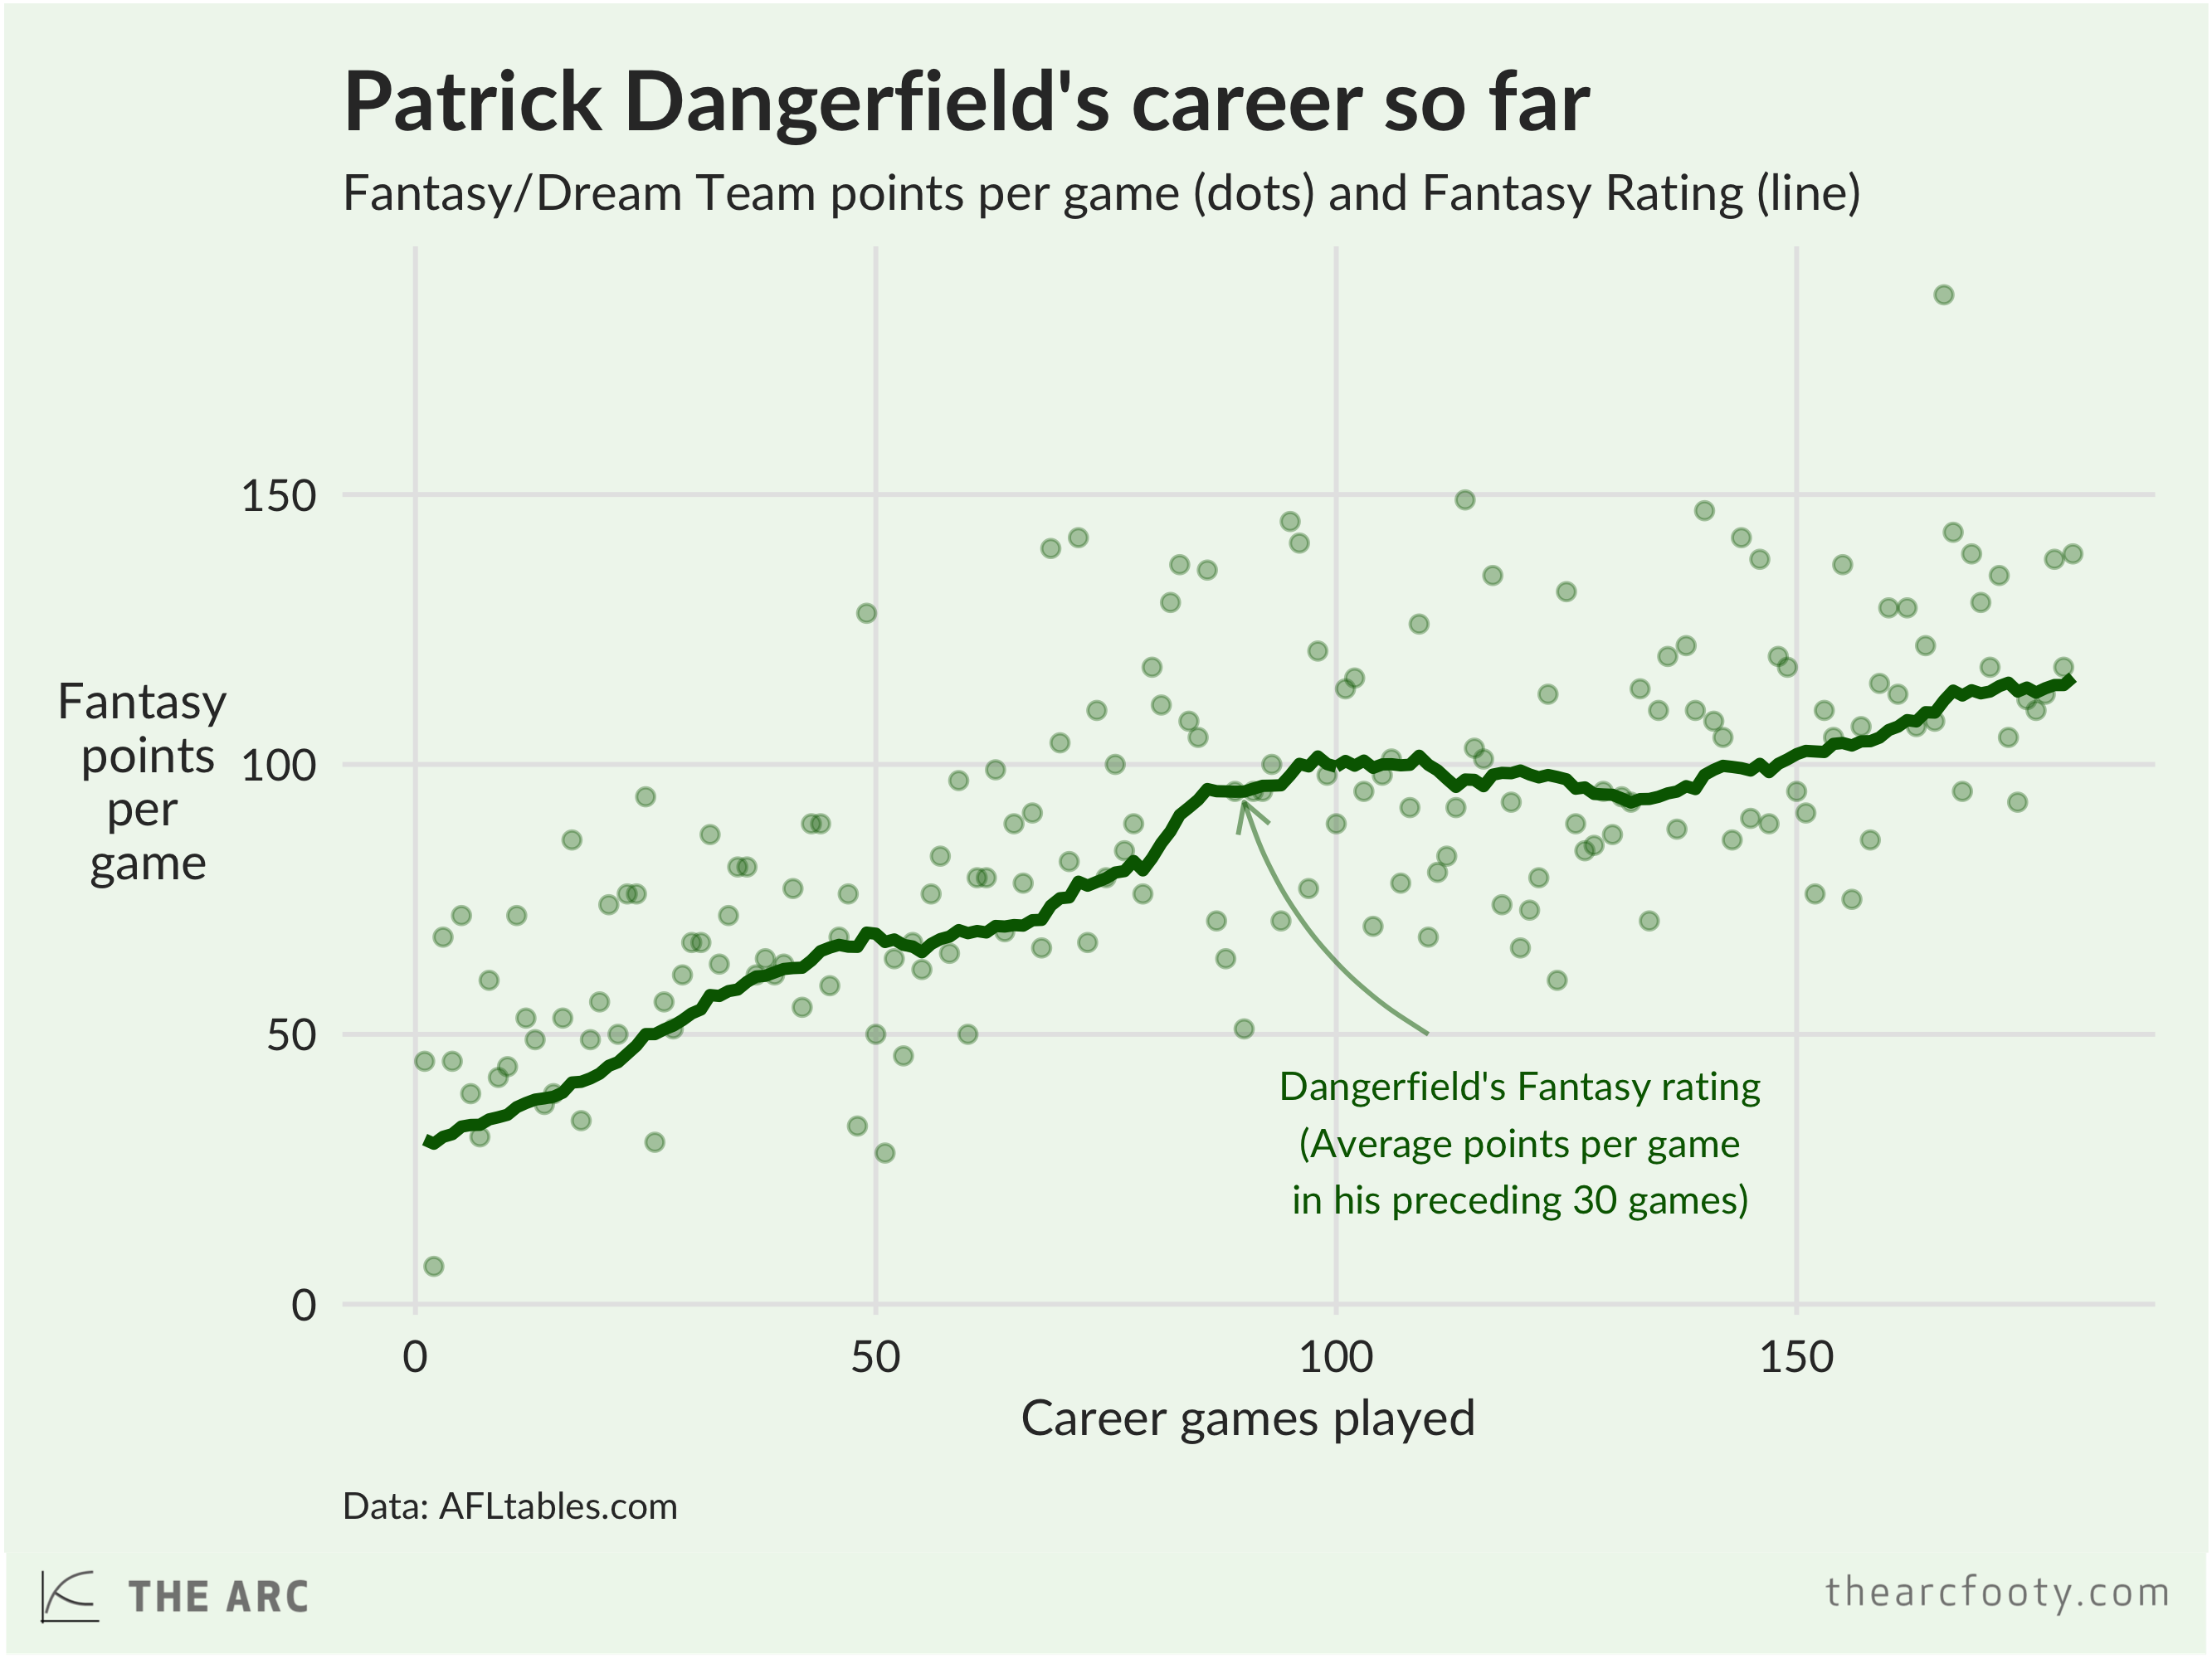
To have a look at how we go from Fantasy points in individual games to Fantasy Ratings, take a look at Patrick Dangerfield’s ratings. Each individual point in this graph corresponds to a game by Dangerfield – it shows how many Fantasy points he recorded in that game. The dark line is his Fantasy Rating, a rolling average of his Fantasy points over the preceding 30 games.

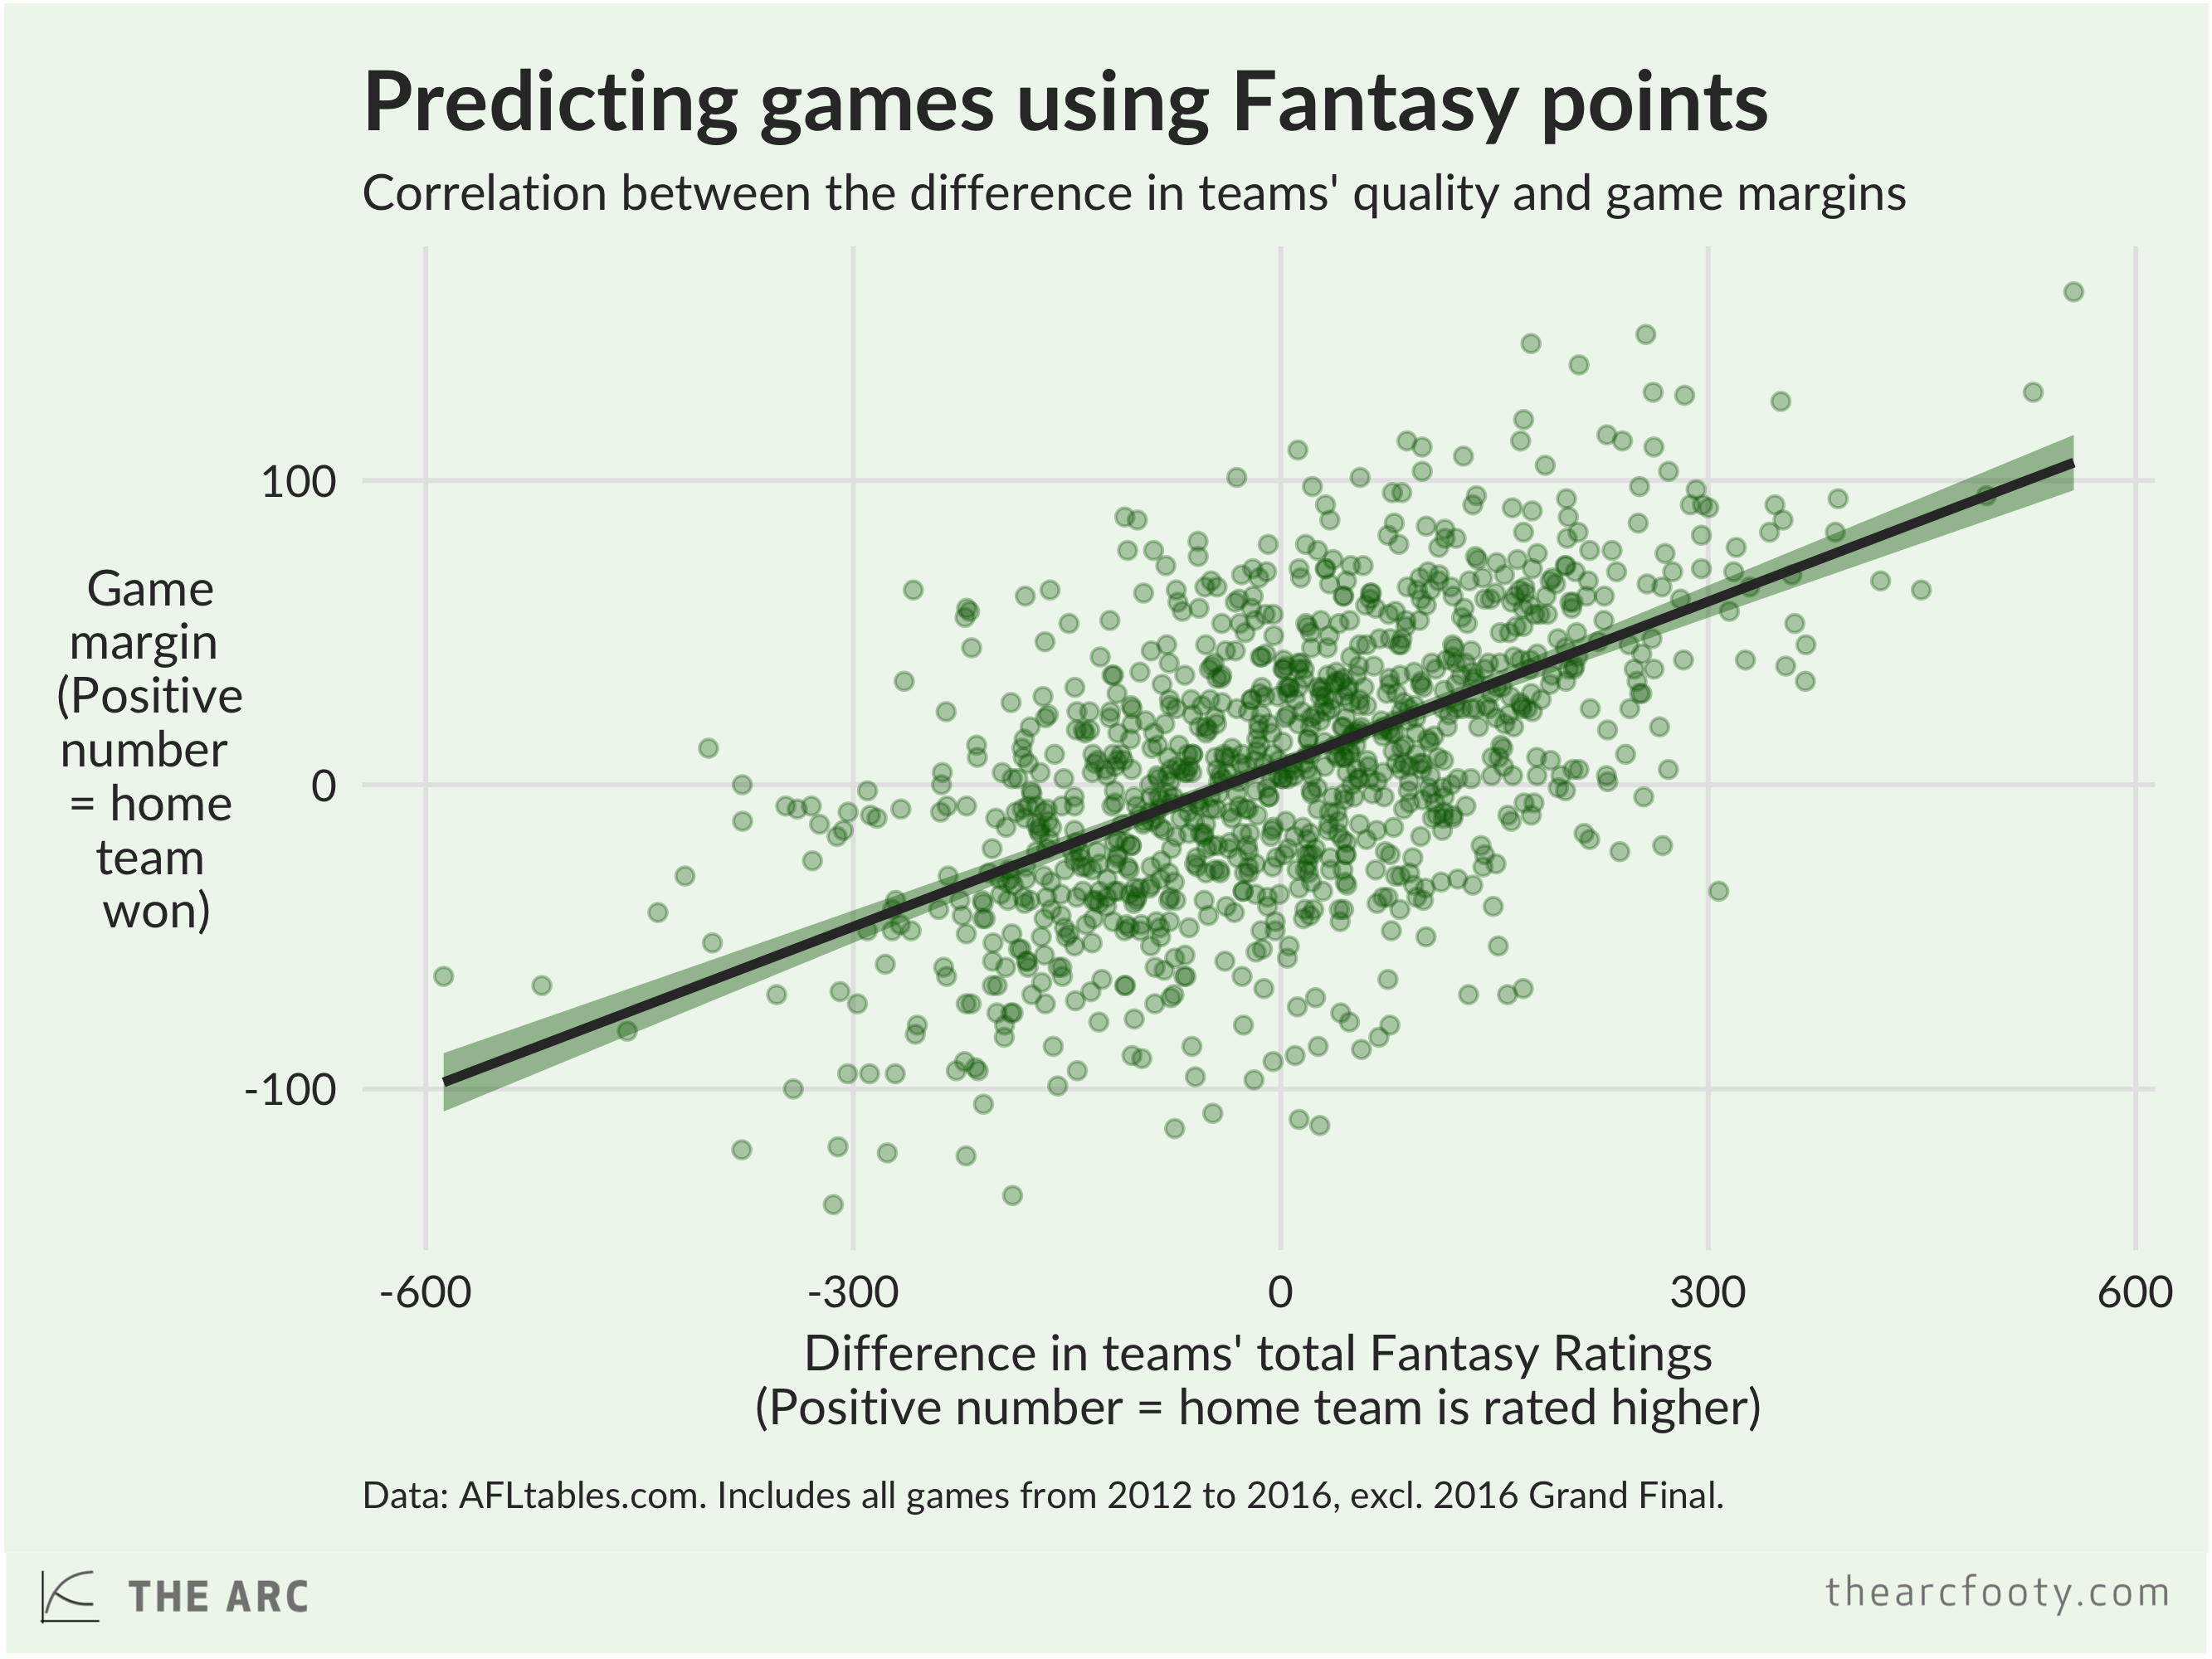
Over his past 30 games, he’s averaged 116 Fantasy points per game, so that’s his Fantasy Rating going into the next game. Simple! Next we just add up the Fantasy Ratings of each of his teammates and we have a measure of Geelong’s quality. If we compare their quality to the opposing team, we have a measure of the difference in teams’ quality that we can use to tip games. So how good a job does it do?

Pretty good! Teams’ quality, as measured by their total Fantasy Ratings, explains 32% of variation in game margins.3 That’s well short of the 39% that the OPRs explain, but it’s not shabby at all. If you’d used the Fantasy Ratings to tip games, you would’ve got 70% of tips correct between 2012 and 2016, ranging from a low of 66% in 2015 to 75.4% in 2012.
Fantasy points are crude, and my method of adding them up to form a ‘rating’ is simple, but the Fantasy Ratings are still quite a powerful predictor of match outcomes. They’re useful.
This raises a bunch of questions. How much better would they be if we took a more sophisticated approach to calculating ratings from individual games? What if we could re-weight Fantasy points, instead of allocating 3 points for a kick, 4 for a tackle and so on? What if we rated players using publicly-available stats that aren’t included in Fantasy points, like contested possessions or goal assists? I plan to work my way through these questions over the coming months to figure out a better way to predict football games using publicly-available data.
- I’m using gender-specific language here as I don’t have AFLW data, unfortunately.
- Rookies start off with a Fantasy Rating of 30 in their first game; over the course of their first 30 games their rating is a weighted average of 30 and their rolling average Fantasy score; the weight diminishes linearly.
- This covers the period 2012-2016, excluding the 2016 Grand Final, as per the Champion Data graph.
