We’ve started rating the strength of each AFL team and using those ratings to predict the results of upcoming games and simulate the remainder of the season. If you’re anything like me, you’ll have a few questions about all that, namely ‘why?’, ‘how?’, and ‘what is the name of the Hungarian physicist who created this ratings system?’. This post answers those questions.
Read more: 2017 ratings and projections | Tips for upcoming games | Complete history of AFL Elo ratings
Why rate teams?
The ladder lies to us. Partway through the 2016 season, it told us that North Melbourne was the best team in the league, having won its first nine straight games. Any sensible footy fan knew this wasn’t true. Seven of the nine teams that the Kangaroos defeated in the first part of the season were mediocre or worse. They played only two interstate away games in those first nine rounds, against Brisbane and Gold Coast. The Kangaroos were unconvincing in the role of league’s best team.
It was clear that the ladder flattered North Melbourne in the early part of the 2016 season. But how much did it flatter them? How good were the ‘Roos, really? A ratings system provides an answer to that question. Team ratings enable us to ‘look through’ the ladder; the ratings take into account the strength of opponents each team has faced, the amount they’ve had to travel, and the margin by which they’ve won or lost their games. The ladder, by contrast, is equally impressed by a narrow win against weak opposition at home and a big win against strong opposition interstate. Our system rated the Roos as the sixth best team in the league after Round 9, 2016, despite their perfect win-loss record in the early part of the season.
Another reason to construct a ratings system is that it provides some (tentative, debatable) answers to questions such as: how big is home-ground advantage? A ratings system also gives us a way of controlling for teams’ quality when calculating the effect of other things, like rest, on game outcomes.
Having a ratings system means we’re able to simulate the season. There are 198 games in the regular season, each of which can end in a win, loss, or draw for the home team. That’s a lot of possible combinations of results, a lot of ways the season can end up. Using a ratings system, we can simulate the season many thousands of times, to see how likely it is that each team will make the finals, or make the top four, or whatever. A by-product of this is that ratings systems can be used to see which team has the hardest schedule, in an unbalanced league like the AFL where teams don’t play each other twice.
With a ratings system, we can also compare the strength of teams over time. Were the 2013-15 Hawks better than the 2001-03 Lions? This is a subjective question without a definitive answer, but a ratings system gives us a good starting point for the debate.
WhICH HUNGARIAN PHYSICIST IS YOUR RATINGS SYSTEM NAMED AFTER?
Good question! Our ratings system is based on the Elo system, which was devised by old mate Arpad Elo to rate chess players. Thanks, Arpad. The Elo system is widely used to rate sports teams, notably by FiveThirtyEight for baseball, basketball and American football team ratings.
The use of an Elo ratings system in AFL isn’t novel. Matter of Stats has several different ratings systems, many of which are Elo variants of one kind or another; Figuring Footy has a very interesting Elo-based system; and other sites like PlusSixOne Blog and FootyMaths have created their own Elo systems. Someone created an AFL Elo system for their PhD thesis. We’re not treading new ground here. Our system takes bits of inspiration from all the other systems that already exist.
How does the elo system work?
The essence of the system is simple. If a team performs better than expected in a particular game, its rating will go up; if it performs worse than expected, its rating will fall. After a game, the change in the two teams’ ratings is symmetrical, so that the increase in one team’s rating is equal to the fall in the other’s. An important thing to bear in mind is that teams can win a game but still see their rating fall after the game, if they win by less than expected.
Easy! There are a few fiddly bits, but bear in mind the simple essence of the system. We make a prediction for a game based on the teams’ pre-game ratings and the home-ground advantage, then we compare the actual result to that prediction, then we update the ratings based on which team over- or under-performed expectations.
Step 1: Choose initial ratings
At the start of each game, each team needs to have a rating for the system to work. Usually, this is just the rating it was left with at the end of the previous game. But what if a team has never played a game before? We need to pick an arbitrary rating to give to new teams. This number will also serve as the league average rating. We’ve chosen to give new teams a rating of 1500, which is standard for Elo systems. The only exceptions are the Gold Coast Suns and GWS Giants, both of which start off with ratings of 1090 before their first games.1
What about the start of the season? We don’t want to just reset teams’ ratings at the start of the year and have each team start the season with an average rating of 1500. We have pretty good reason to think that the 2017 Swans will be better than the 2017 Lions, for example, and it would be silly to pretend otherwise. But we also don’t want to assume that each team will be exactly as good at the start of the season as they were at the end of last season. Players get old, some of them retire or are de-listed, while younger players improve. On average, it’s reasonable to expect a team that was bad one year to be a little better the following year, while good teams generally get a little worse.
Our model has a relatively small pre-season adjustment to teams’ ratings, with teams only regressing 10% of the way towards the league average rating of 1500. This means a team that ended one season with a 1600 rating will enter the next rated 1590, while a team with a 1400 rating will start the next year at 1410. This relatively modest between-season adjustment was chosen by finding the value that worked best over the period from 2000-2015, as I’ll describe a bit later. I suspect that this is one parameter we’ll revise in future years – free agency probably means that teams’ performance one year is a decreasingly reliable guide to their performance the following year.
Let’s work through an example to see how the system works. We’ll look at the Western Bulldogs v Adelaide game in Round 7, 2016. Our first step is to figure out each team’s rating prior to the match. The Crows entered the game with an Elo rating of 1630, while the Bulldogs had a rating of 1582. Those are both solidly above average, but the Crows were rated as the stronger team. If their game were to be played on neutral turf, we’d expect the Crows to win.
Step 2: calculate home-ground advantage
The Crows were rated as a better team than the Dogs in Round 7, but their game was being played on the Dogs’ home turf at Docklands. How much should this affect our judgement about which team is likely to win? To answer that, we need to define and measure home-ground advantage.
Home-ground advantage could be a Thing for any number of reasons. Home teams could get a boost because because they’re more familiar with the ground, or because the crowd exerts some psychological influence on the players or the umpires, or because the burden of travel (usually) falls more heavily on the visting team.
We break home-ground advantage into two parts: ground familiarity and distance travelled. Using this definition of home-ground advantage, the designated ‘home team’ might not always have an advantage. When the Brisbane Bears played a home game against West Coast at the WACA, the Eagles would receive an advantage in our system, because they didn’t have to travel and they had more experience at the ground. When the Hawks play home games in Launceston against other Melbourne teams, they both travel the same amount, so there’s no travel advantage for either team; the Hawks get a modest ‘home-ground’ advantage from their greater experience at the venue.2
We calculate ground familiarity as the number of times a team has played at a particular ground in the current season, plus the preceding two seasons. We then take the difference between the two teams’ recent experience at the ground using this formula:
![]()
Away.exp is the total number of games that the away team has played at the ground in the current season and the previous two, and Home.exp is the same thing for the home team. Over the 2014 and 2015 seasons, plus the first six rounds of 2016, the Bulldogs played 33 games at Docklands, while Adelaide played eight. Using the equation above, we calculate Exp for this game as 1.329.
The other component of home-ground advantage is Travel, which we calculate like this:
![]()
Away.dist is the number of kilometres the away team has travelled, and Home.dist is the same for the home team. The distance is calculated between the team’s home city and the city in which the game is played. In the Bulldogs-Adelaide game, the Crows travelled 654.3 kms, while the Bulldogs didn’t travel. The travel difference (Travel), calculated with the formula above, is therefore 8.68.
We put the venue experience differential and travel differential together to calculate overall home-ground advantage, like this:
![]()
We’ve picked values of 6 for ![]() and 15 for
and 15 for ![]() , based on an optimisation process we’ll explain later. So for the Western Bulldogs-Adelaide game, we calculate the home-ground advantage as:
, based on an optimisation process we’ll explain later. So for the Western Bulldogs-Adelaide game, we calculate the home-ground advantage as:
![]()
That figure, 72, doesn’t mean that we think the home team will win by 72 points. It’s a figure that we add to the difference in Elo ratings in the next step.
Step 3: predict the result
Now we have the teams’ pre-game ratings and the home-ground advantage, we can make a prediction about the result. We do that using the following formula:

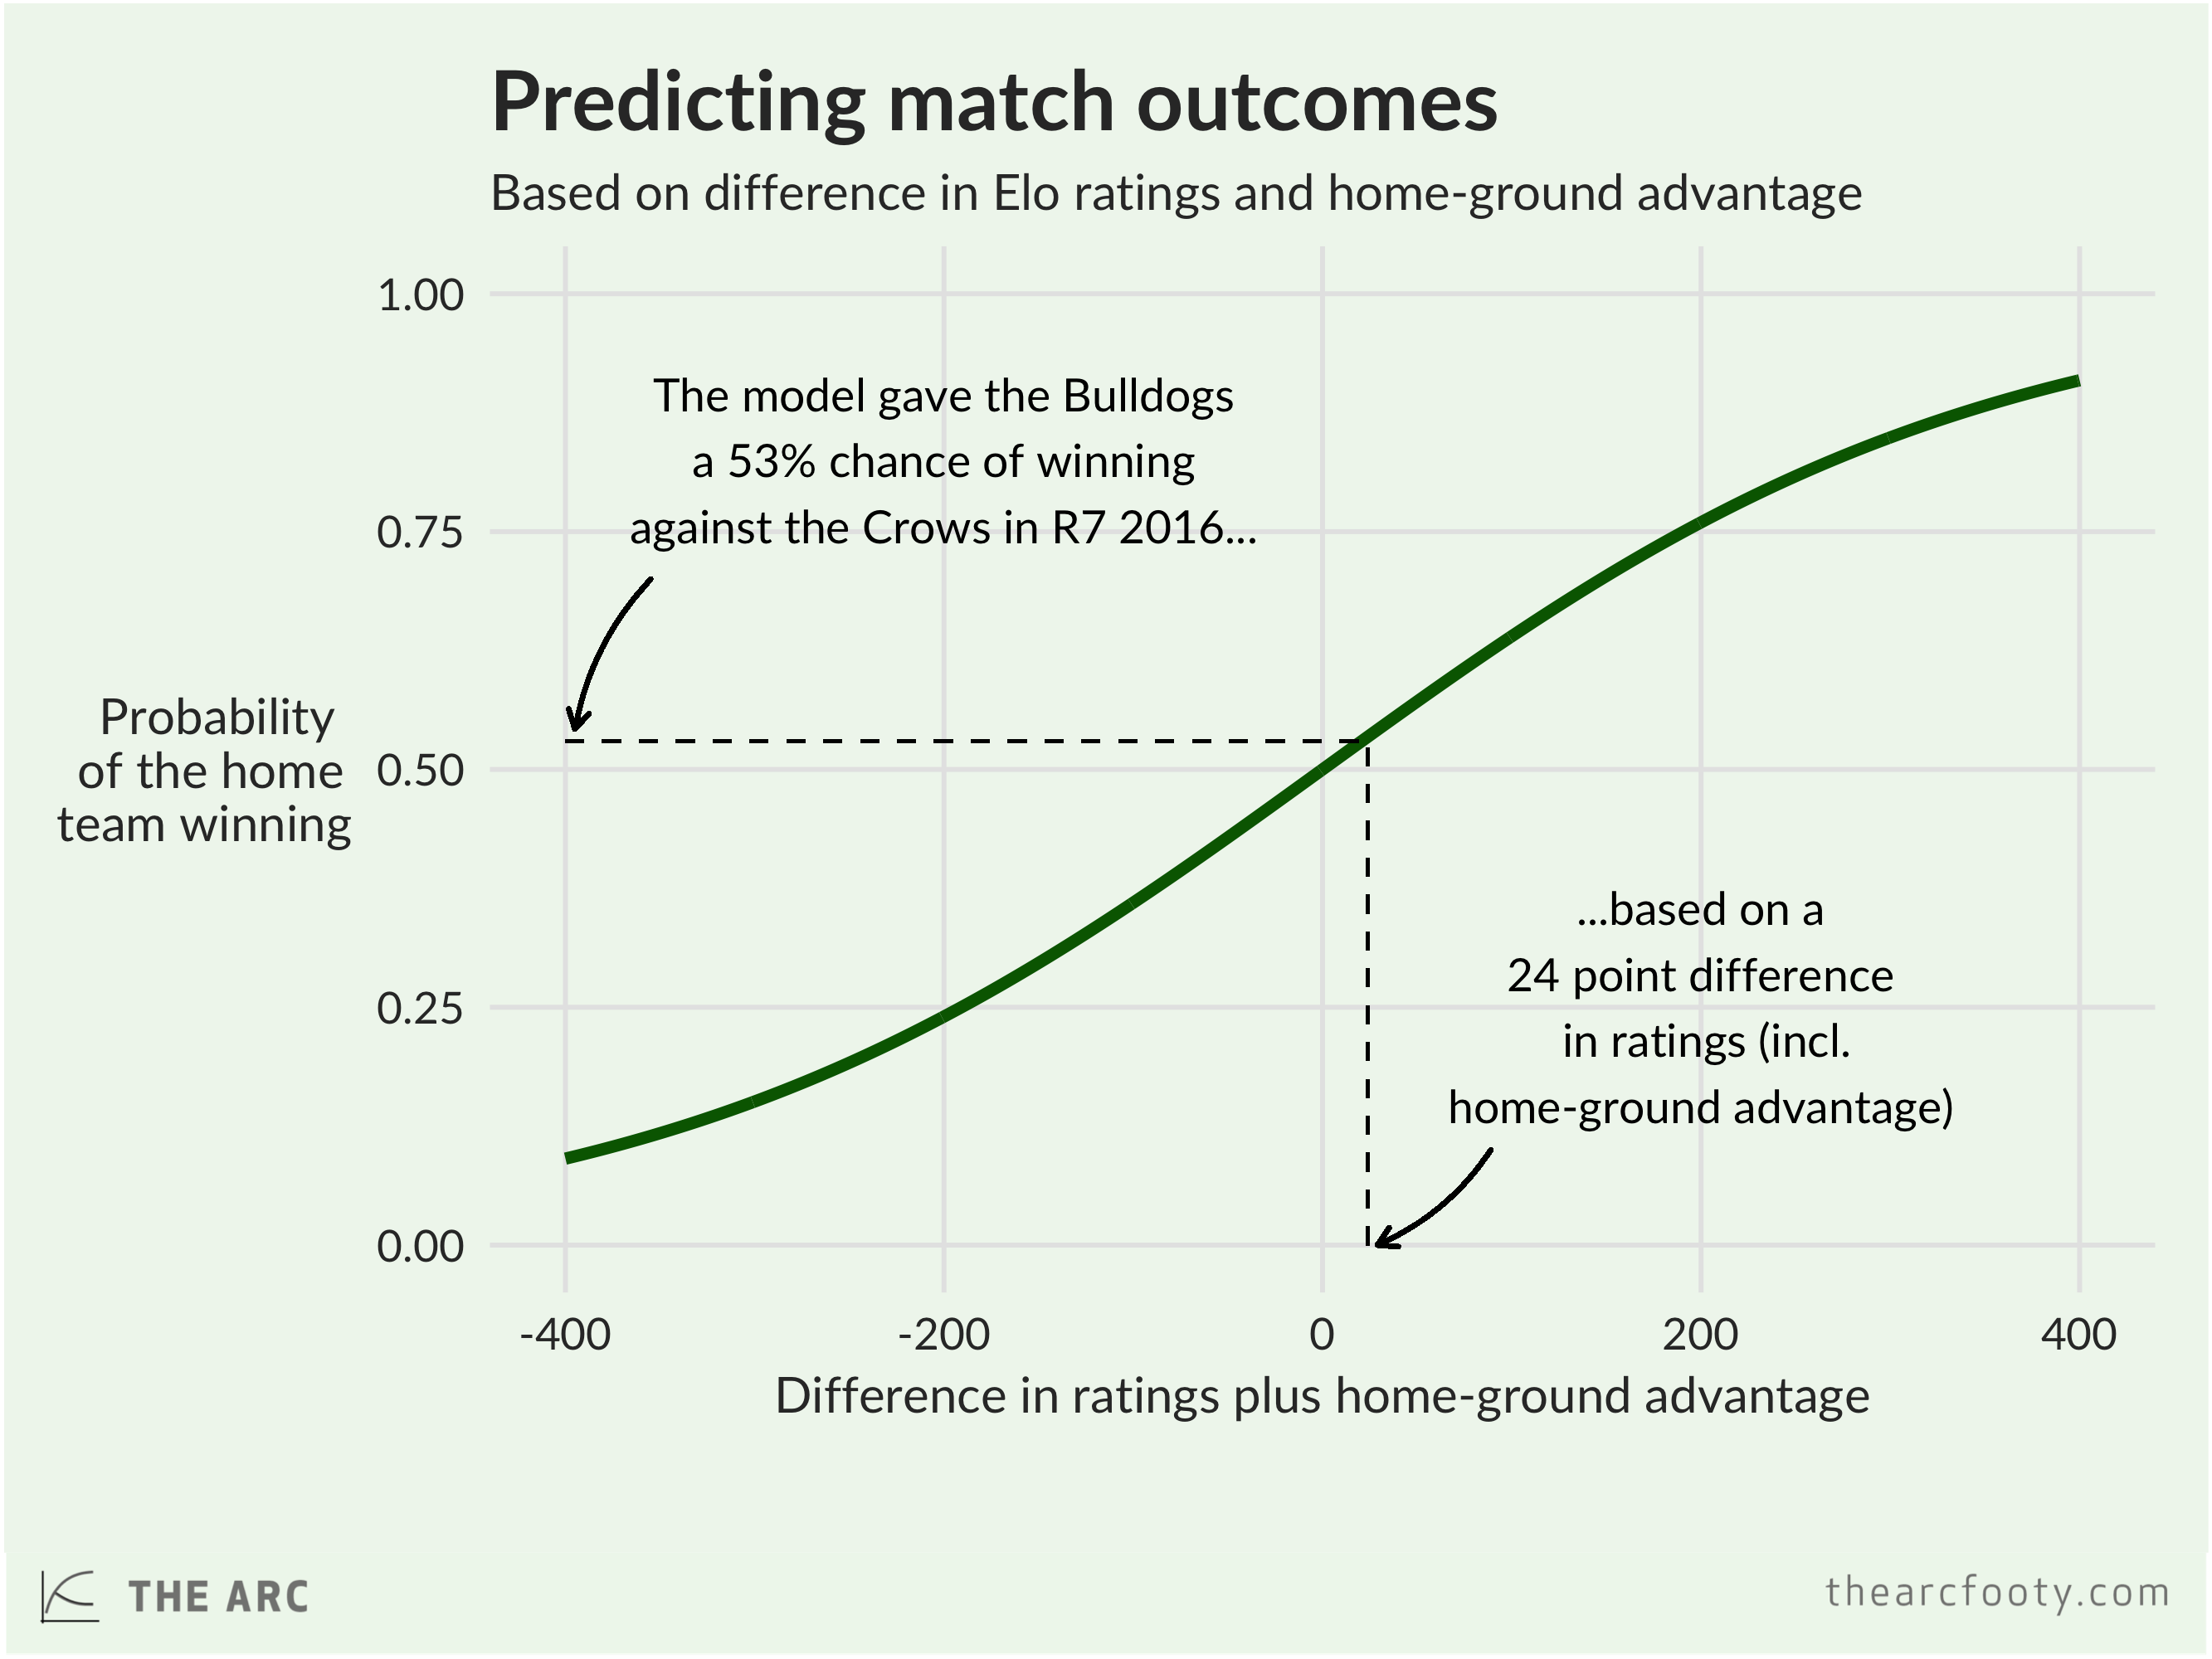
There’s another new parameter we’ve introduced here, m, for which we use a value of 400. The formula gives us predicted results on a 0-1 scale, where 0 is a 0% probability of winning and 1 is a 100% chance.
For the Bulldogs-Crows game, we calculate the predicted result as follows:

Even though the Crows were the higher rated team in Round 7, the Dogs had enough of a home-ground advantage that they were favoured to win by the Elo model, which gave them a 53% chance of victory.

We can convert that into a predicted margin for the game as follows, using a value of 0.0464 for the parameter ![]() :
:
![]()
In the Dogs-Crows game, the model predicted a 2.9 point Bulldogs victory, calculated as:
Step 4: convert the actual result to a 0-1 scale
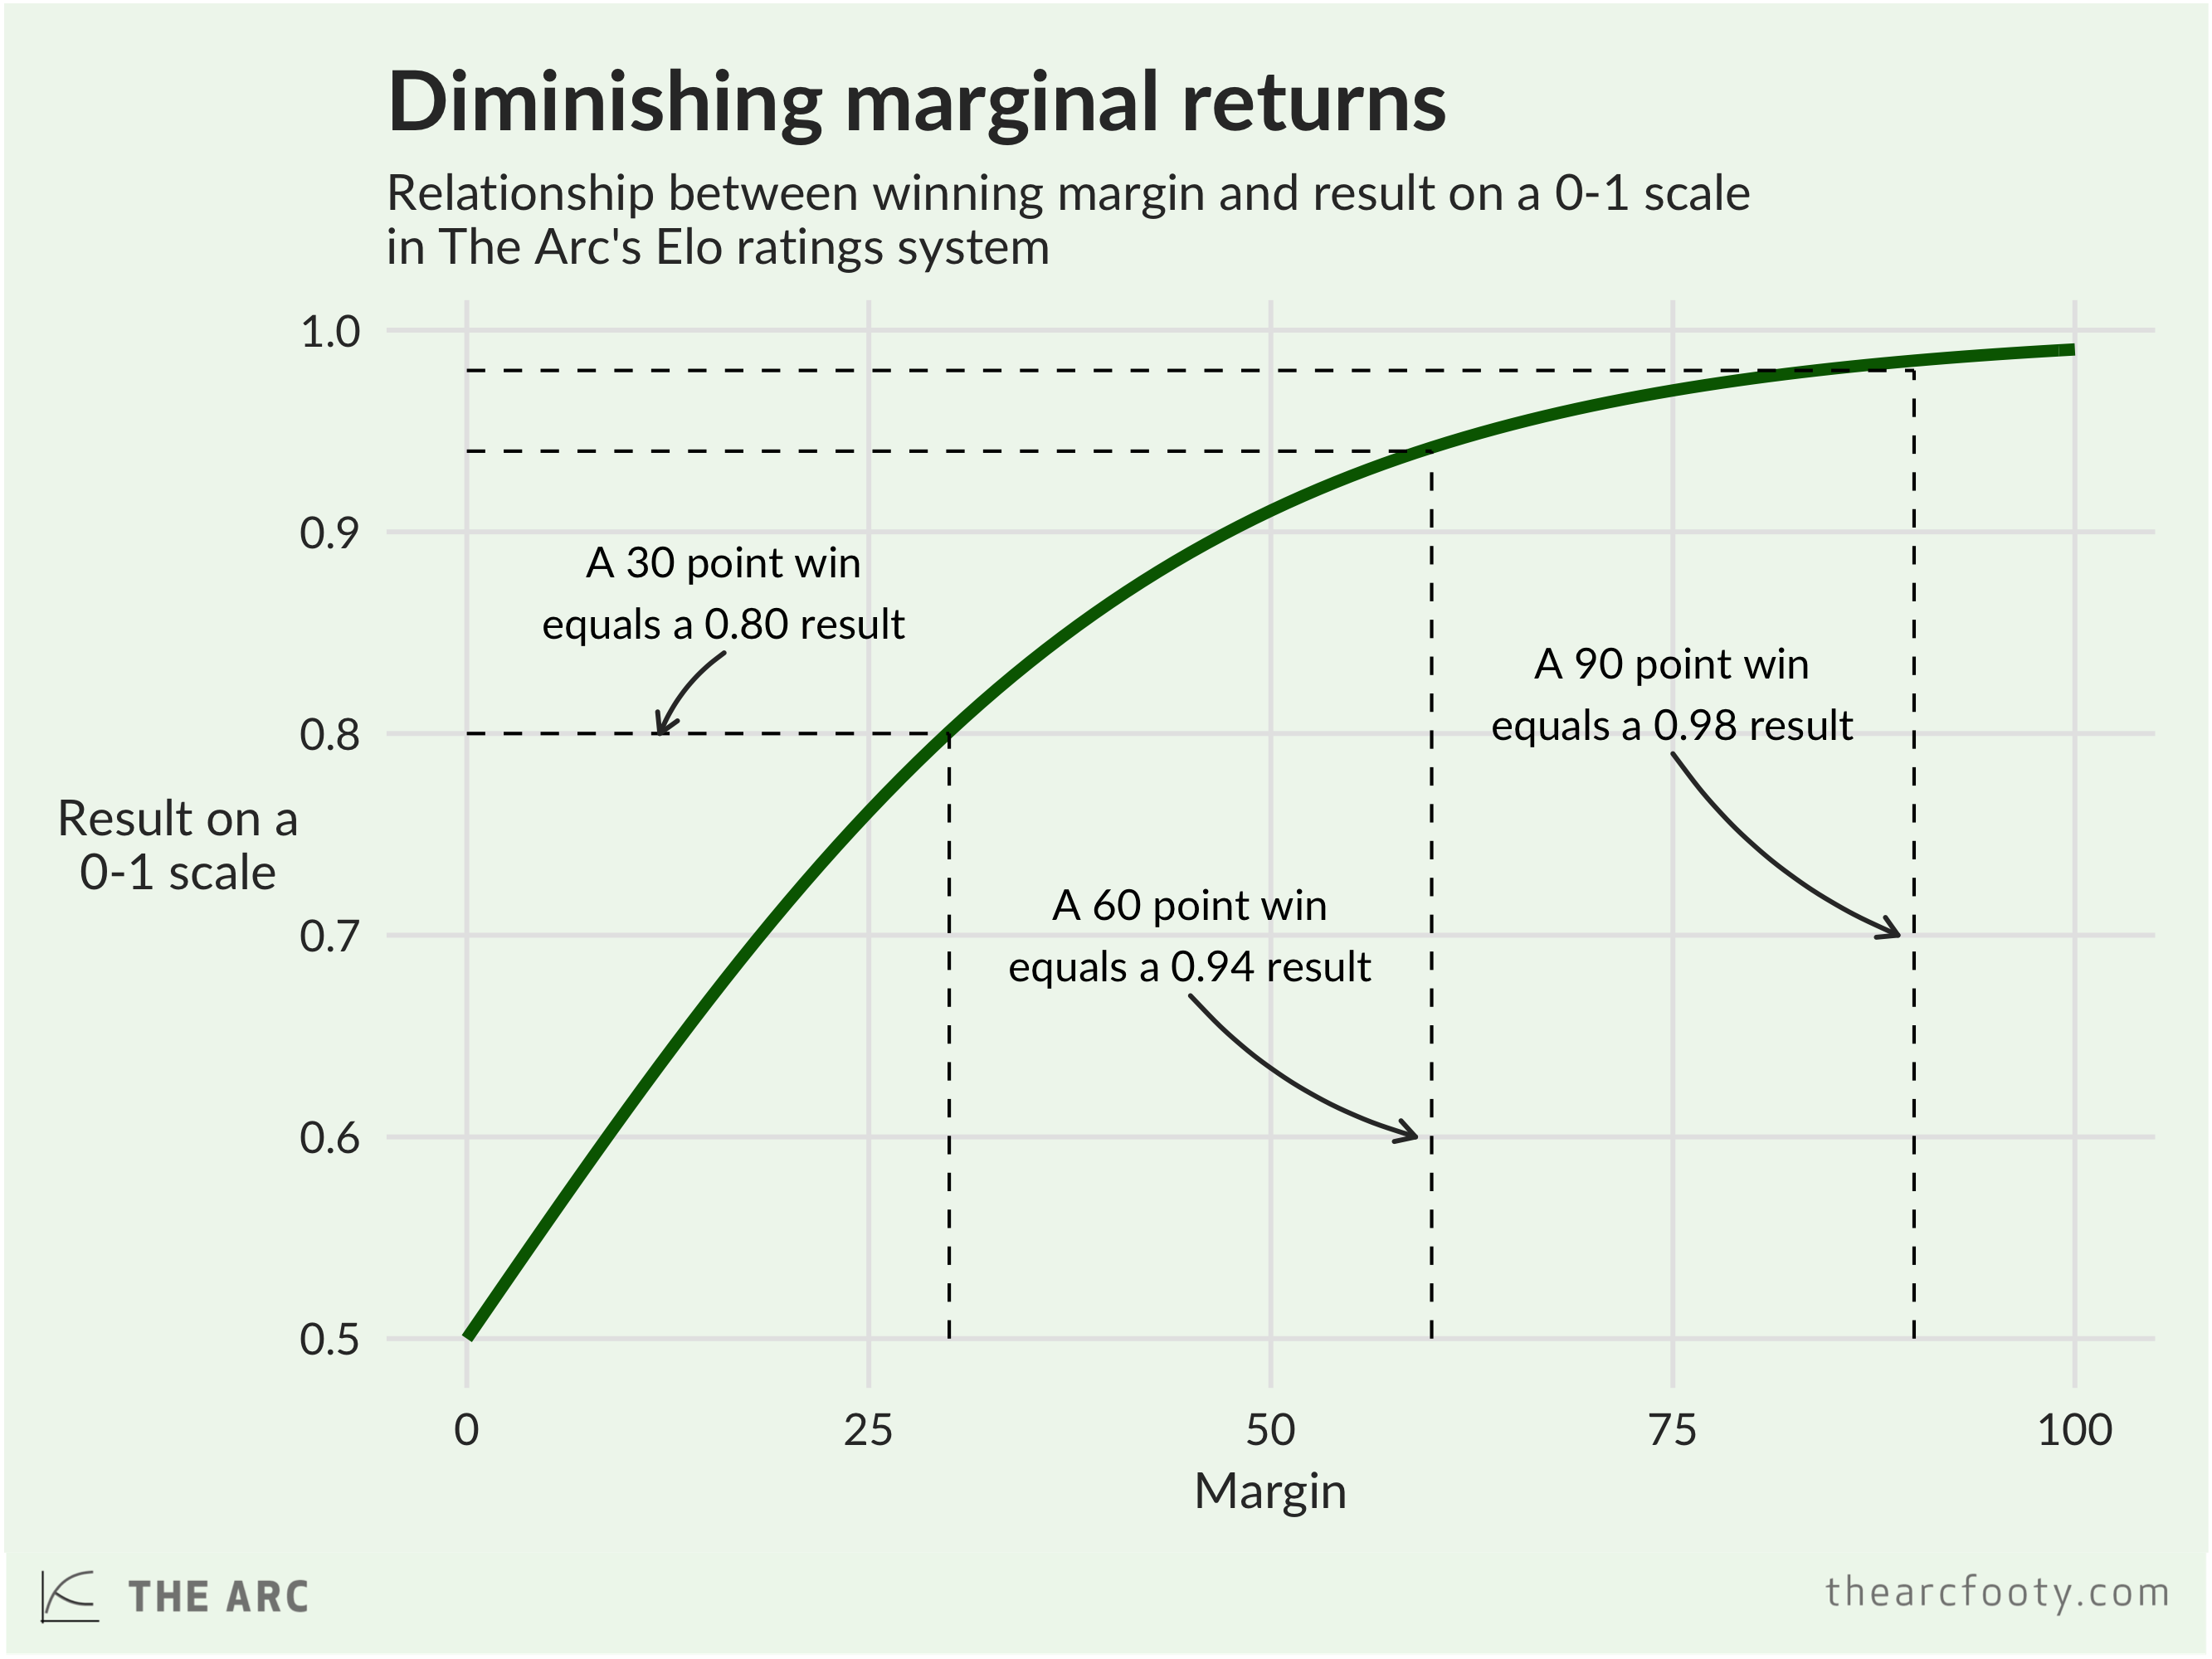
The next step is to compare teams’ actual performance to their predicted performance. To do that, we need to convert the actual result – the margin between the teams’ scores on the scoreboard – to a result on a scale from zero to one. We do that using this formula:
![]()
If you’re algebraically inclined, you will have noticed an important feature in this formula. It’s this: there are diminishing marginal returns, which is a fancy-ish way of saying that the ratings system isn’t that much more impressed by a 15 goal flogging than it is by a 10 goal drubbing.

Looking back to the Bulldogs-Crows game, the Dogs performed better than our model expected, beating the Crows by 15 points. That converts to a result on the zero-one scale like this:
![]()
Step 5: update the ratings
We expected the Bulldogs to win by around 2.9 points, but they actually won by 15. Because they performed better than expected, their rating will go up after the game, while the Crows’ rating will go down.
The home team’s rating is updated with this formula:
![]()
Here we’ve got yet another parameter, k, for which we need a value. This is the key parameter in Elo ratings systems – a low value of k means that teams’ ratings will be fairly stable over time, only rising or falling by a little bit after each game, while a large k means the ratings will respond more rapidly.
In our model, k can take one of three different values. During the first five rounds of the season, we use a value of k = 82; in the finals, we use a value of k = 72. For the rest of the year, we use k = 62. 4 These are towards the aggressive end of the spectrum, meaning that our ratings move around more rapidly in response to results.
The Dogs-Crows game was in Round 7, so we use the regular k = 62 to update their ratings after the game. The Bulldogs’ new rating after Round 7, 2016 is:
![]()
The Dogs’ rating rises by 8.3 points. The adjustment for the Crows is exactly the opposite; their rating falls from 1630.4 to 1622.5
STEP 6: THERE IS NO STEP 6
That’s it! You predict the result, based on the teams’ pre-game Elo ratings and the home-ground advantage, then compare the result to that prediction, then adjust the teams’ ratings based on how much they over- or under-performed expectations.
doesn’t your model give teams credit for their luck?
Yes, inadvertently! Acute observation you’ve made there.
Goal-kicking accuracy is not very reliable. If a team is very accurate one week, kicking many more goals than points, that is not a good guide to how accurate they’ll be kicking at goal the following week; teams’ accuracy looks essentially random. So if a team gets fewer scoring shots than their opponents, but ends up winning the game because they were more accurate, their win is in part the result of luck.
Ideally we want a ratings system to reflect teams’ quality, not their luck. That’s why Tony Corke at Matter of Stats built a system that rates teams based on their ability to generate scoring shots and to prevent their opponents from generating scoring shots, rather than their ability to get points on the scoreboard. Rob Younger at Figuring Footy has a system that rates teams based on the quality, as well as quantity, of scoring shots they generate.
The rationale for rating teams based on their scoring shots, rather than their scores, is compelling. I expect that the scoring shot-based ratings systems will probably be more accurate tippers than our Elo system. Despite this, we’ve stuck with a simpler system that rates teams based on the scoreboard margin, because this is easier to explain and understand. In the future, it’s quite likely we’ll introduce new team rating models, which might include a scoring shot-based model.
Choosing Optimal Parameters
Cool little subheading, that one! ‘Choosing Optimal Parameters’, real clickbait stuff.
Uh, anyway : parameters! There are quite a few parameters in the model for which we need to choose values, like k and the ![]() and
and ![]() we used to calculate home-ground advantage. Tweaking these parameters results in the model making very different predictions. Funnily enough, we’d want to choose a set of parameters that make good predictions rather than a set of parameters that make bad predictions. But what do we mean by a good prediction? What are we trying to predict, anyway – match winners or winning margins?
we used to calculate home-ground advantage. Tweaking these parameters results in the model making very different predictions. Funnily enough, we’d want to choose a set of parameters that make good predictions rather than a set of parameters that make bad predictions. But what do we mean by a good prediction? What are we trying to predict, anyway – match winners or winning margins?
Models that are the very best at tipping the winners of AFL games tend not to be the very best at tipping the margin of AFL games, and vice versa. This is why the king of AFL predictive modelling, Tony Corke at Matter of Stats, has different models for the margin and the result. To keep things simple, so we’ve gone with a set of parameters that are not the very best at picking winners, and not the very best at picking margins, but are quite good at doing both.
To be specific, we chose the set of parameter values that maximised the percentage of games in which the model correctly tipped the winning team, subject to the constraint that the average difference between the predicted and actual margin had to be less than 29.9 points. We calculated the parameters based on all game results in the 2000 to 2015 seasons, inclusive.6 We didn’t use 2016 results to optimise the parameters, so that we can use 2016 as a test of the model.
SHOW US YOUR TIPS
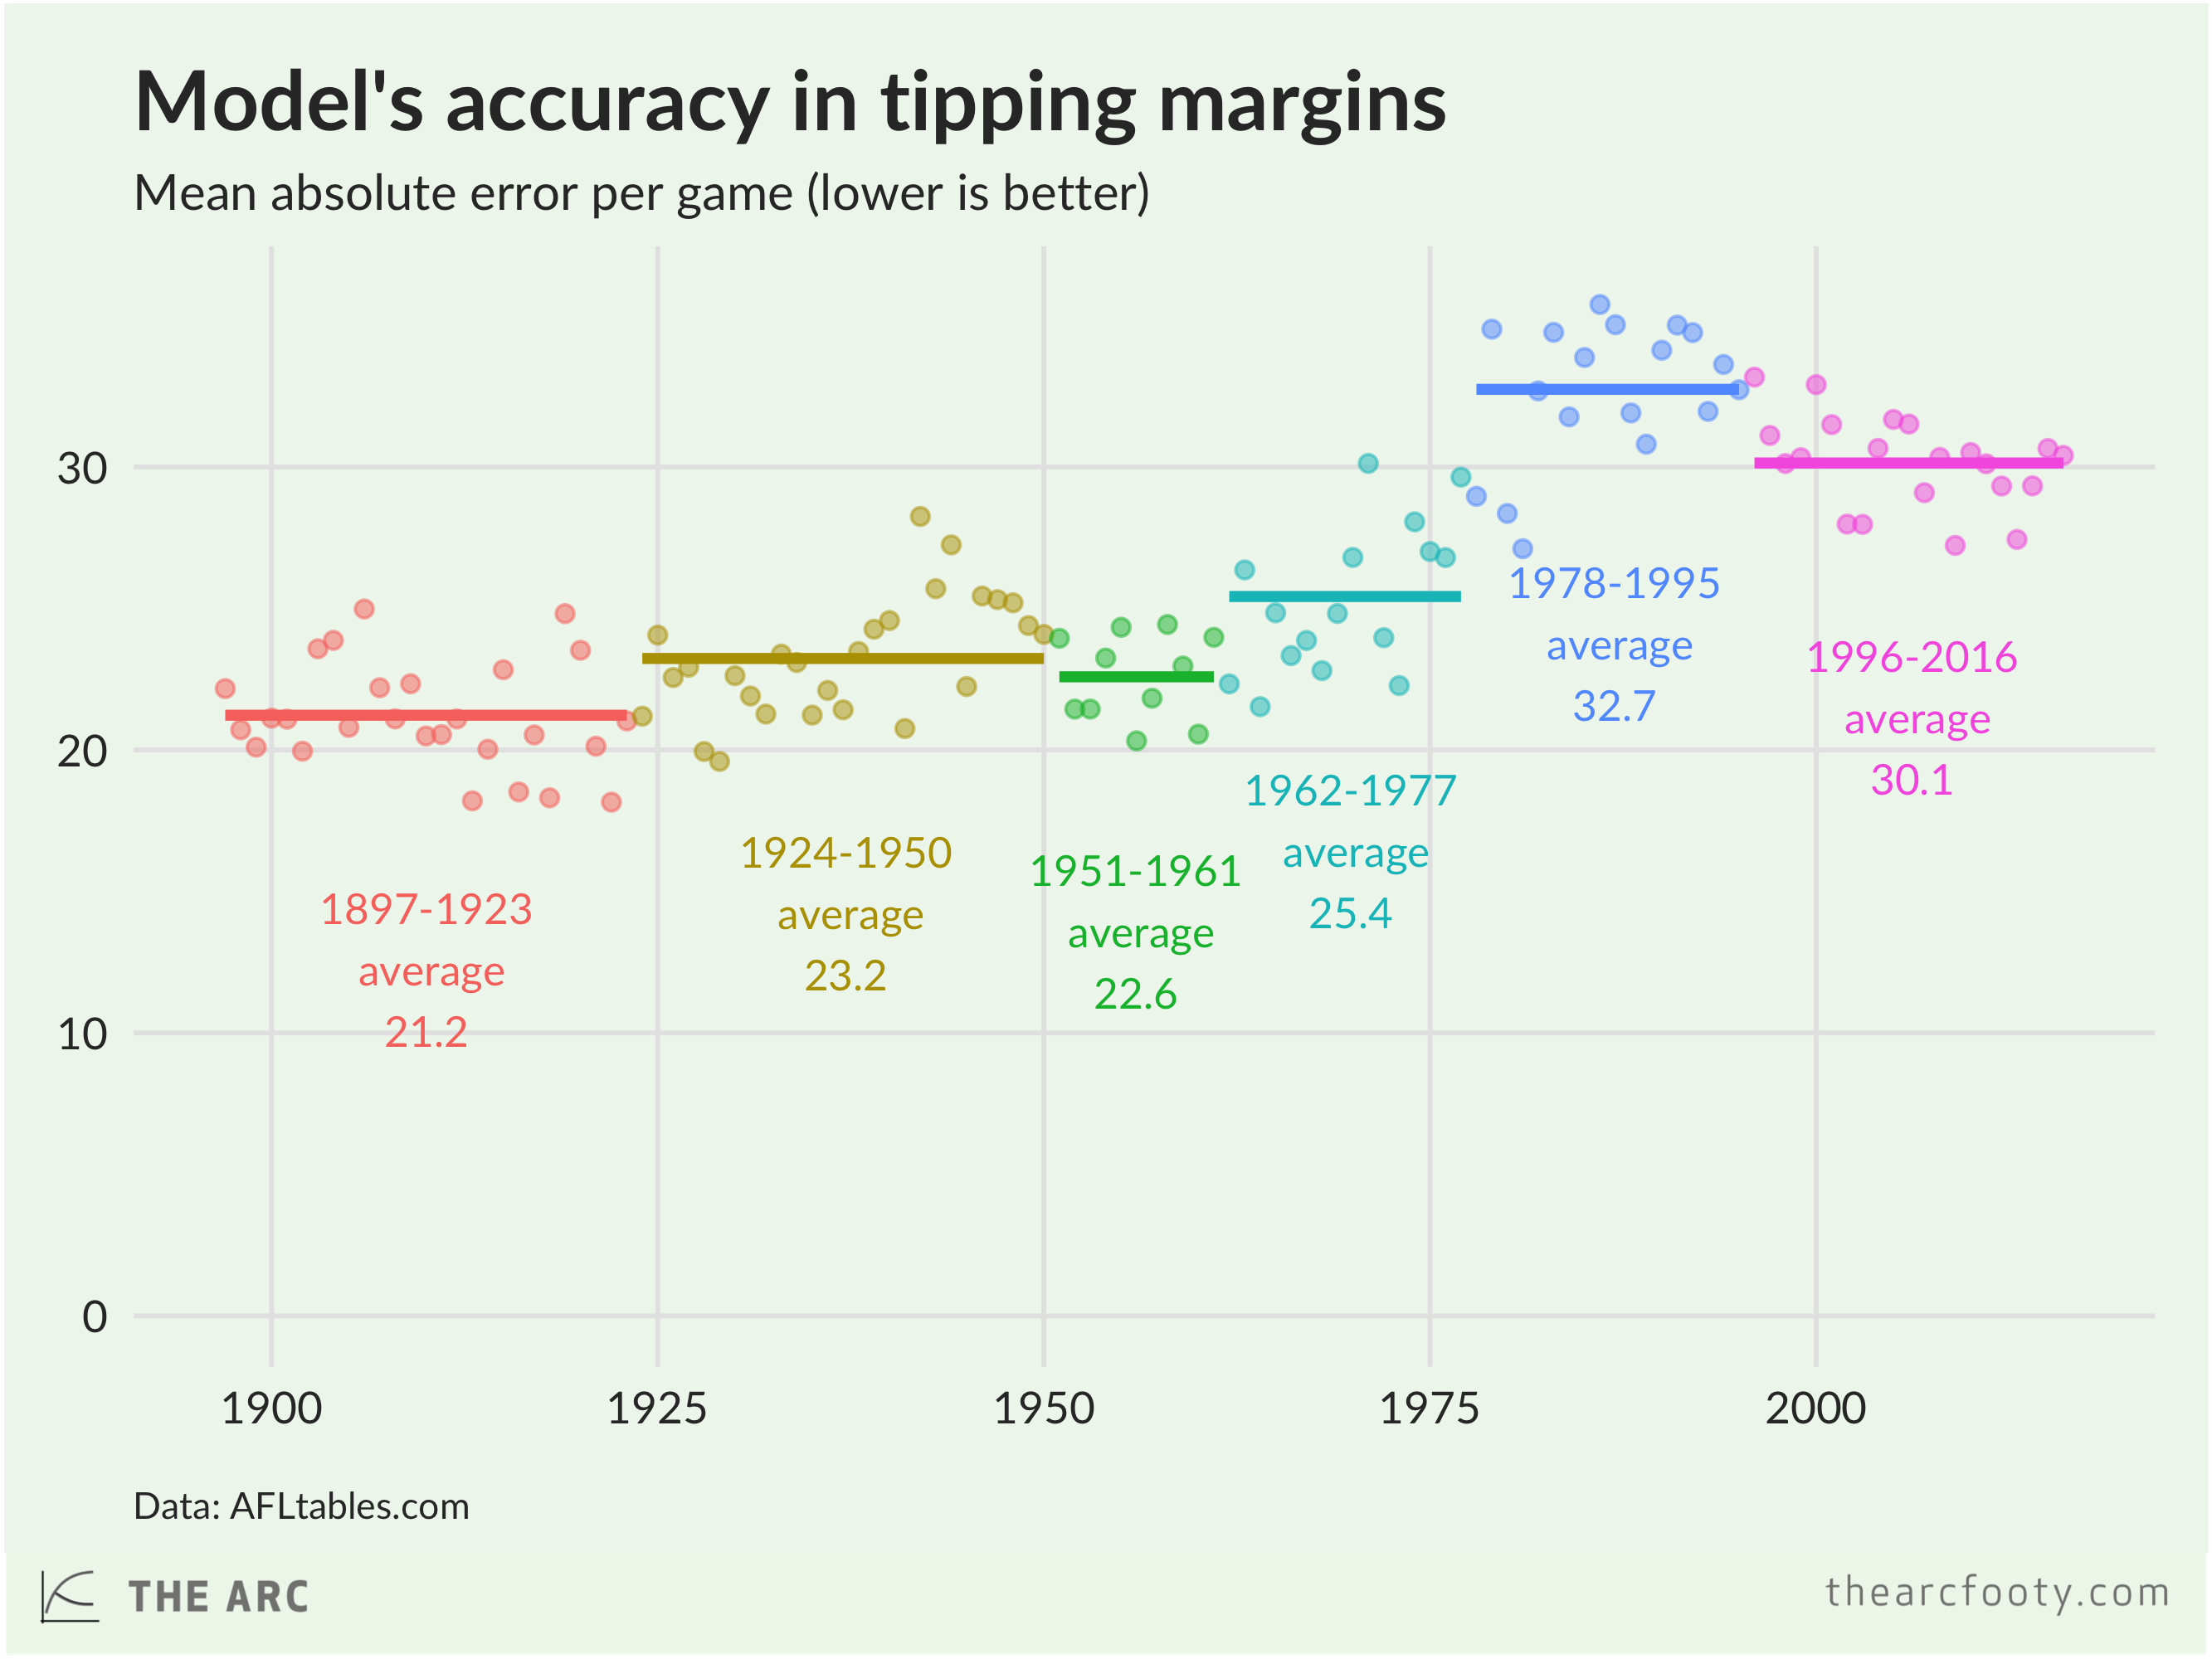
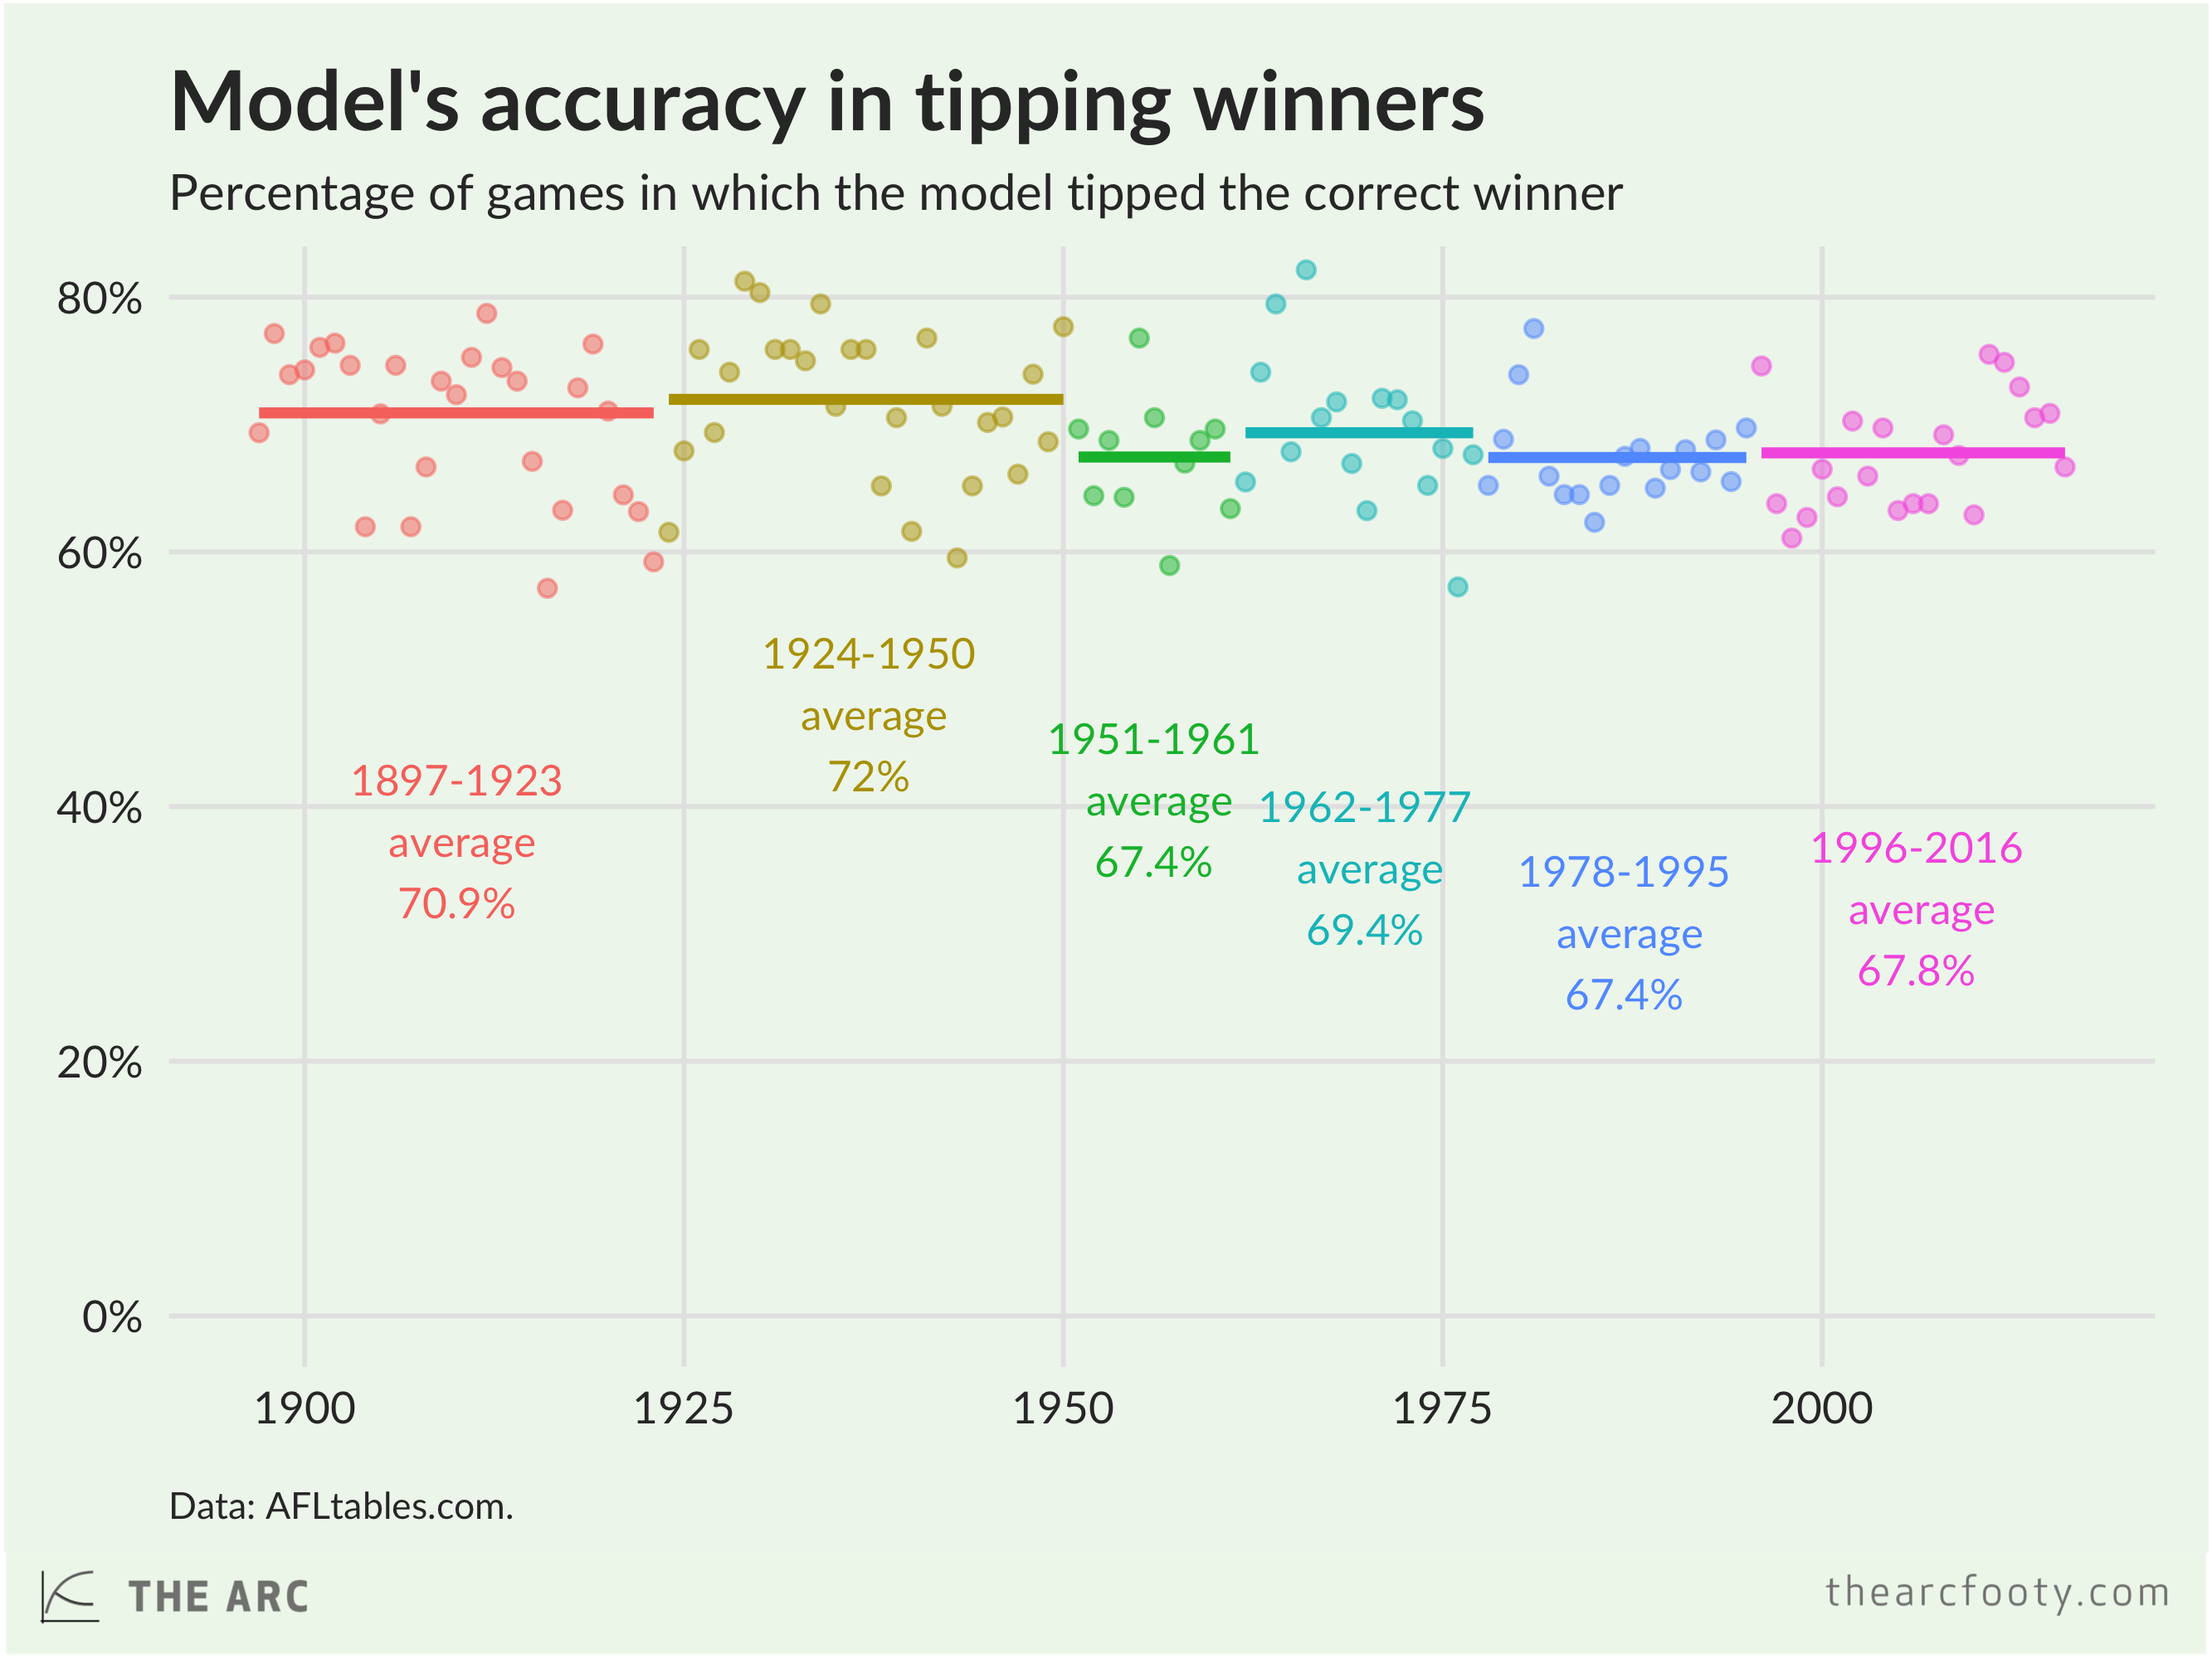
The ratings system correctly tipped the winner in 68.4% of games over the period from 2000 to 2015 (inclusive), with an average difference of 29.87 points between the predicted margin and the actual margin. Those results are pretty decent, but remember that the games over this period were used to choose the parameters for the model. The real test is how it performs on new games. Happily enough, the system performed acceptably in 2016, tipping 66.7% of winners correctly with an average of 30.4 points between the tipped margin and actual margin. That’s probably not good enough to win your tipping competition, or to make money from the bookies, but it’s acceptable performance for a simple model.
|
Despite being optimised to perform well in the current century, the model also performs decently at tipping winners and margins across past eras as well.


SIMULATIONS, HOW DO THEY WORK?
One of the main uses of Elo ratings is to simulate the season. We can run through a lot of simulated seasons to calculate how likely it is that a team makes the finals, or wins the spoon.
This is how it works:
- Calculate the expected result for each game in Round 1, on a 0-1 scale, using the formula from Step 3;7
- Convert the expected result to a predicted margin; 8
- Calculate an actual (simulated) margin for each game by drawing a random number from a normal distribution. The mean of the distribution is the game’s predicted margin and the standard deviation is 37.1;
- Update each team’s Elo ratings based on whether they over- or under-performed expectations;
- Repeat all the steps above for every game of the season, constructing a ladder within each simulation and updating the ladder after each game.9
- Then simulate the season (repeating all the steps above) at least 10 000 times.
If you’re well-steeped in your Elo controversies, you’ll have noticed that we’ve taken a side in an interesting methodological divide in the simulating-the-results-of-sporting-seasons community. On one side, we have the venerable Tony Corke at Matter of Stats, the undisputed heavyweight champ of AFL Elo models. On the other side, Nate Silver and his minions at FiveThirtyEight.
The difference of opinion is about whether to update teams’ ratings within simulations.10 Despite The Arc’s general approach, which is to regard Tony Corke’s way of doing things as The Way To Do Things, we’ve gone with FiveThirtyEight’s methodology here. This means teams’ ratings rise and fall within simulations, just as they do in response to real life results. I like this approach because it builds in greater uncertainty about games that are further in the future.
DOES YOUR MODEL KNOW ABOUT ASADA?
Nope! The Elo system is oblivious to changes in personnel. This means that if a key player gets injured, or returns to the side, this will affect the side’s likelihood of winning future matches, but this isn’t reflected in the win probabilities calculated by the Elo system. Elo ratings are formed solely based on the team’s past results, and the simulations and predictions are based on those ratings.
In most cases, I don’t think this matters that much. An individual Australian football player almost definitely has a smaller influence on his or her team’s results than a single basketball player, or a starting pitcher in baseball. But in extreme cases, it’s a problem.
Essendon comes to mind as an extreme case. The Elo ratings system (and any similar system) overrated the Bombers at the start of 2016, unaware that half their starting lineup had been banned for the season. The system also almost definitely underrates Essendon at the start of the 2017 season, because it doesn’t know that the club will have a large number of talented players returning to the fold. This is one reason we’ve built our system to react more quickly to results at the start of the year; Essendon will be underrated at the start of the season, but their rating should quickly converge to its ‘true’ level.
SHUT UP AND TELL ME WHICH TEAM IS THE BEST
OK! Here’s how the teams were rated at the end of 2016.
|
Your ratings are intriguing to me and I wish to subscribe to your newsletter
Why, thank you very much! You can see our latest projections for the season here and our tips for upcoming games here. Sign up to our email list in the sidebar, if you were serious about the whole newsletter thing. If you’re on your mobile or a tablet, there should be a little button at the top of the page that will open the sidebar.
Read more: 2017 ratings and projections | Tips for upcoming games | Complete history of AFL Elo ratings
- To keep the league average rating at 1500, we redistribute the 410 points (1500-1090) equally among the other teams at the start of the 2011 and 2012 seasons.
- ‘Ground experience’ probably captures not only players’ familiarity with the ground itself, but is a proxy for the one-sidedness of the crowd. If the Hawks play in Launceston often, and their opponents don’t, the Launceston crowd is more likely to be full of Hawthorn partisans.
- Some numbers have been rounded.
- We also experimented with a separate value for ‘junk’ games towards the end of the home and away season in which at least one team is out of finals contention, but ended up going with k = 62 for these games.
- I won’t generally be reporting Elo ratings with the decimal point, as this is a little bit spuriously precise. They’re included here just so you can follow on with the calculations if you’re so inclined.
- For testing purposes, each run of the model was initialised in 1997 with team ratings set to 1500.
-


- Our system is based around predicting the margin between teams’ scores; it doesn’t predict the scores themselves. To construct a ladder, we need to estimate teams’ points for and against, in order to calculate percentage. We assume the losing team (or both teams in a draw) score 75 points, while the winner scores 75 plus the simulated margin.
- Read Tony’s description of the issue if you’re interested.
